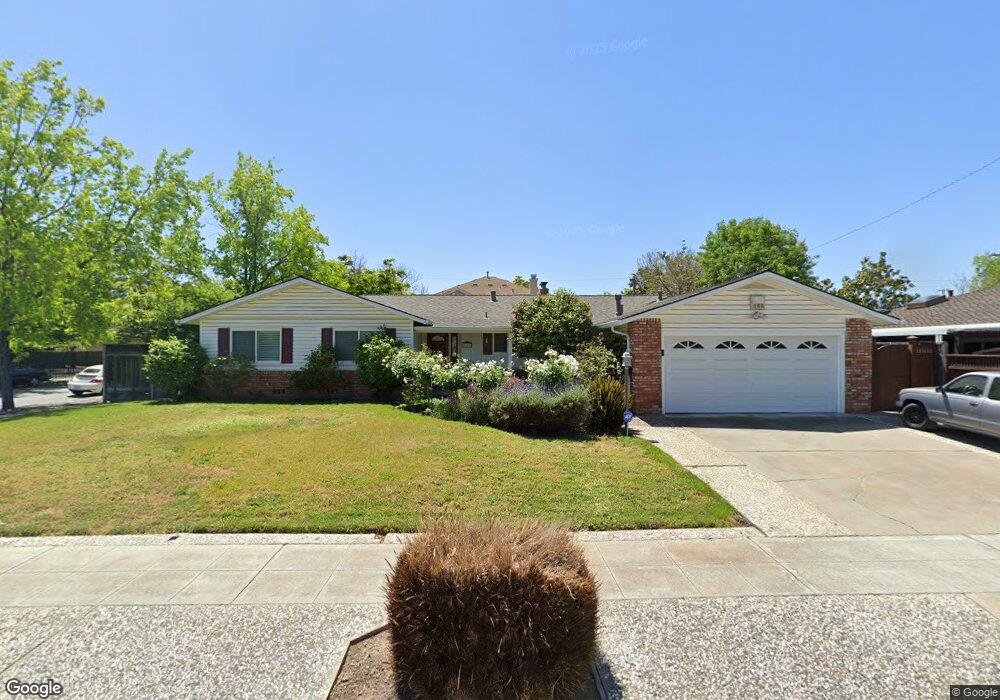
5176 Eileen Dr San Jose, CA 95129
Country Lane NeighborhoodEstimated Value: $2,556,000 - $3,556,000
4
Beds
3
Baths
2,133
Sq Ft
$1,383/Sq Ft
Est. Value
About This Home
This home is located at 5176 Eileen Dr, San Jose, CA 95129 and is currently estimated at $2,949,154, approximately $1,382 per square foot. 5176 Eileen Dr is a home located in Santa Clara County with nearby schools including Country Lane Elementary School, Moreland Middle School, and Prospect High School.
Ownership History
Date
Name
Owned For
Owner Type
Purchase Details
Closed on
Jul 1, 2002
Sold by
King Diane L and King Raymond G
Bought by
Santos Joel M and Santos Valerie C
Current Estimated Value
Home Financials for this Owner
Home Financials are based on the most recent Mortgage that was taken out on this home.
Original Mortgage
$577,500
Outstanding Balance
$246,029
Interest Rate
6.78%
Estimated Equity
$2,703,125
Purchase Details
Closed on
May 7, 2002
Sold by
King Diane L and King Raymond G
Bought by
King Raymond G and King Diane L
Home Financials for this Owner
Home Financials are based on the most recent Mortgage that was taken out on this home.
Original Mortgage
$577,500
Outstanding Balance
$246,029
Interest Rate
6.78%
Estimated Equity
$2,703,125
Purchase Details
Closed on
Sep 15, 2000
Sold by
King Diane L
Bought by
King Raymond G and King Diane L
Create a Home Valuation Report for This Property
The Home Valuation Report is an in-depth analysis detailing your home's value as well as a comparison with similar homes in the area
Home Values in the Area
Average Home Value in this Area
Purchase History
| Date | Buyer | Sale Price | Title Company |
|---|---|---|---|
| Santos Joel M | $825,000 | First American Title Guarant | |
| King Raymond G | -- | North American Title Co | |
| King Raymond G | -- | -- | |
| King Diane L | -- | -- |
Source: Public Records
Mortgage History
| Date | Status | Borrower | Loan Amount |
|---|---|---|---|
| Open | Santos Joel M | $577,500 | |
| Previous Owner | King Raymond G | $150,000 | |
| Closed | Santos Joel M | $82,500 |
Source: Public Records
Tax History
| Year | Tax Paid | Tax Assessment Tax Assessment Total Assessment is a certain percentage of the fair market value that is determined by local assessors to be the total taxable value of land and additions on the property. | Land | Improvement |
|---|---|---|---|---|
| 2025 | $16,108 | $1,194,858 | $896,079 | $298,779 |
| 2024 | $16,108 | $1,171,430 | $878,509 | $292,921 |
| 2023 | $15,902 | $1,148,462 | $861,284 | $287,178 |
| 2022 | $15,665 | $1,125,945 | $844,397 | $281,548 |
| 2021 | $15,404 | $1,103,869 | $827,841 | $276,028 |
| 2020 | $15,100 | $1,092,551 | $819,353 | $273,198 |
| 2019 | $14,560 | $1,071,130 | $803,288 | $267,842 |
| 2018 | $14,210 | $1,050,129 | $787,538 | $262,591 |
| 2017 | $14,127 | $1,029,540 | $772,097 | $257,443 |
| 2016 | $13,398 | $1,009,354 | $756,958 | $252,396 |
| 2015 | $13,299 | $994,193 | $745,588 | $248,605 |
| 2014 | $12,655 | $974,719 | $730,983 | $243,736 |
Source: Public Records
Map
Nearby Homes
- 1526 Crespi Dr
- 1489 Saratoga Ave
- 1416 Constanso Way
- 4792 Englewood Dr
- 5005 Doyle Rd
- 5492 Castle Glen Ave
- 1103 Del Cambre Dr
- 4567 Hamilton Ave
- 19061 Brookhaven Dr
- 1518 Parkview Ave
- 1601 Duvall Dr
- 19150 Brookhaven Dr
- 5733 Harder St
- 5745 Harder St
- 12584 Paseo Flores
- 12135 Country Squire Way
- 1295 Flora Ave
- 12619 Saratoga Ave
- 1145 Little John Way
- 4149 Alberstone Dr
- 5194 Eileen Dr
- 5175 Lassen Ave
- 00000 Beck Latson
- 5181 Lassen Ave
- 5177 Eileen Dr
- 5212 Eileen Dr
- 5189 Lassen Ave
- 5195 Eileen Dr
- 5231 Lassen Ave
- 5213 Eileen Dr
- 5154 Country Ln
- 5230 Eileen Dr
- 5174 Lassen Ave
- 5178 Lassen Ave
- 5170 Country Ln
- 5168 Lassen Ave
- 5184 Lassen Ave
- 5241 Lassen Ave
- 5160 Lassen Ave
- 5192 Lassen Ave
Your Personal Tour Guide
Ask me questions while you tour the home.