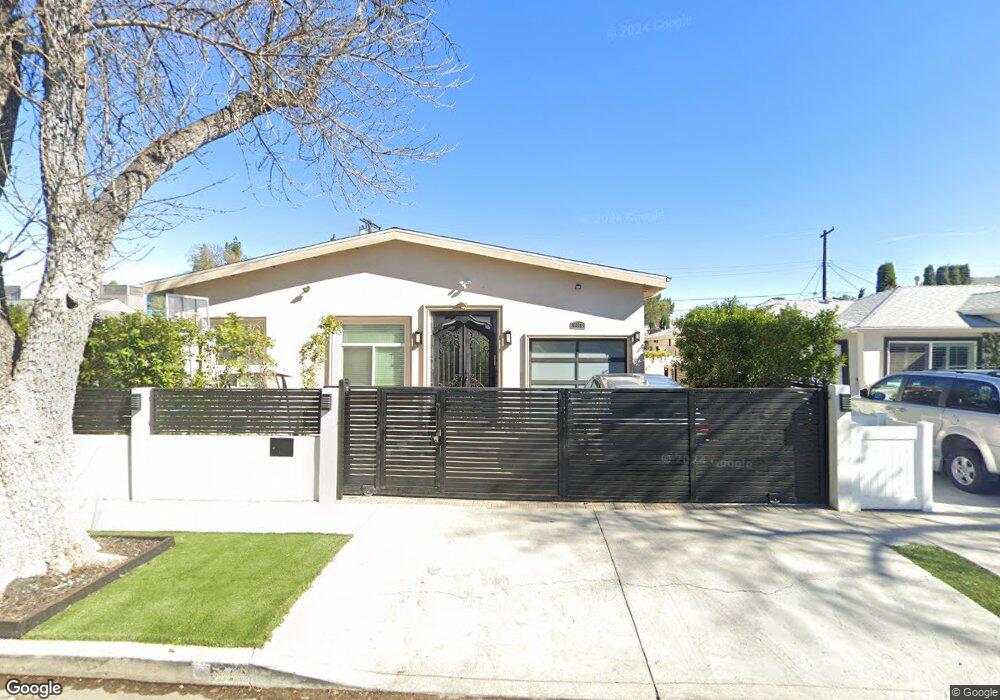
5176 Nestle Ave Tarzana, CA 91356
Estimated Value: $1,376,000 - $1,805,000
4
Beds
3
Baths
2,283
Sq Ft
$666/Sq Ft
Est. Value
About This Home
This home is located at 5176 Nestle Ave, Tarzana, CA 91356 and is currently estimated at $1,519,933, approximately $665 per square foot. 5176 Nestle Ave is a home located in Los Angeles County with nearby schools including Gaspar De Portola Middle School, Nestle Avenue Charter, and Emelita Street Elementary.
Ownership History
Date
Name
Owned For
Owner Type
Purchase Details
Closed on
Nov 15, 2021
Sold by
Danil David and Danil Hilda
Bought by
Danil Living Trust and Danil
Current Estimated Value
Purchase Details
Closed on
Jun 21, 2016
Sold by
Ohel Llc
Bought by
Danil David and Kohanchi Hilda
Home Financials for this Owner
Home Financials are based on the most recent Mortgage that was taken out on this home.
Original Mortgage
$625,500
Interest Rate
3.5%
Mortgage Type
Adjustable Rate Mortgage/ARM
Purchase Details
Closed on
Dec 16, 2013
Sold by
Danil David
Bought by
Ohel Llc
Purchase Details
Closed on
Feb 12, 2013
Sold by
Curiel Gisela
Bought by
Danil David
Purchase Details
Closed on
Aug 17, 1993
Sold by
Citibank Fsb
Bought by
Curiel Gisela
Home Financials for this Owner
Home Financials are based on the most recent Mortgage that was taken out on this home.
Original Mortgage
$120,000
Interest Rate
3.12%
Create a Home Valuation Report for This Property
The Home Valuation Report is an in-depth analysis detailing your home's value as well as a comparison with similar homes in the area
Home Values in the Area
Average Home Value in this Area
Purchase History
| Date | Buyer | Sale Price | Title Company |
|---|---|---|---|
| Danil Living Trust | -- | None Listed On Document | |
| Danil David | -- | Chicago Title Co | |
| Ohel Llc | -- | Accommodation | |
| Danil David | $215,300 | None Available | |
| Curiel Gisela | $161,000 | First American Title Company |
Source: Public Records
Mortgage History
| Date | Status | Borrower | Loan Amount |
|---|---|---|---|
| Previous Owner | Danil David | $625,500 | |
| Previous Owner | Curiel Gisela | $120,000 |
Source: Public Records
Tax History Compared to Growth
Tax History
| Year | Tax Paid | Tax Assessment Tax Assessment Total Assessment is a certain percentage of the fair market value that is determined by local assessors to be the total taxable value of land and additions on the property. | Land | Improvement |
|---|---|---|---|---|
| 2025 | $9,162 | $751,894 | $532,705 | $219,189 |
| 2024 | $9,162 | $737,152 | $522,260 | $214,892 |
| 2023 | $8,986 | $722,699 | $512,020 | $210,679 |
| 2022 | $8,569 | $708,530 | $501,981 | $206,549 |
| 2021 | $7,941 | $650,717 | $492,139 | $158,578 |
| 2019 | $7,705 | $631,418 | $477,543 | $153,875 |
| 2018 | $7,529 | $619,038 | $468,180 | $150,858 |
| 2016 | $6,466 | $533,298 | $414,213 | $119,085 |
| 2015 | $6,371 | $525,289 | $407,992 | $117,297 |
| 2014 | $4,956 | $396,792 | $326,475 | $70,317 |
Source: Public Records
Map
Nearby Homes
- 5120 Etiwanda Ave
- 5157 Avenida Oriente
- 5319 Lindley Ave
- 18240 Weddington St
- 5310 Lindley Ave
- 5132 Lindley Ave
- 5334 Lindley Ave Unit 115
- 5334 Lindley Ave Unit 334
- 5407 Garden Grove Ave
- 18324 Clark St Unit 119
- 18324 Clark St Unit 315
- 5108 Otis Ave
- 5412 Lindley Ave Unit 108
- 5339 Newcastle Ave Unit 112
- 5339 Newcastle Ave Unit 205
- 5339 Newcastle Ave Unit 103
- 5325 Newcastle Ave Unit 108
- 5325 Newcastle Ave Unit 319
- 5325 Newcastle Ave Unit 328
- 5325 Newcastle Ave Unit 327
- 5182 Nestle Ave
- 5172 Nestle Ave
- 5173 Garden Grove Ave
- 5200 Nestle Ave
- 5166 Nestle Ave
- 5179 Garden Grove Ave
- 5169 Garden Grove Ave
- 5163 Garden Grove Ave
- 5185 Garden Grove Ave
- 5177 Nestle Ave
- 5160 Nestle Ave
- 5204 Nestle Ave
- 5173 Nestle Ave
- 5183 Nestle Ave
- 5167 Nestle Ave
- 5157 Garden Grove Ave
- 5191 Garden Grove Ave
- 5203 Nestle Ave
- 5156 Nestle Ave
- 5210 Nestle Ave