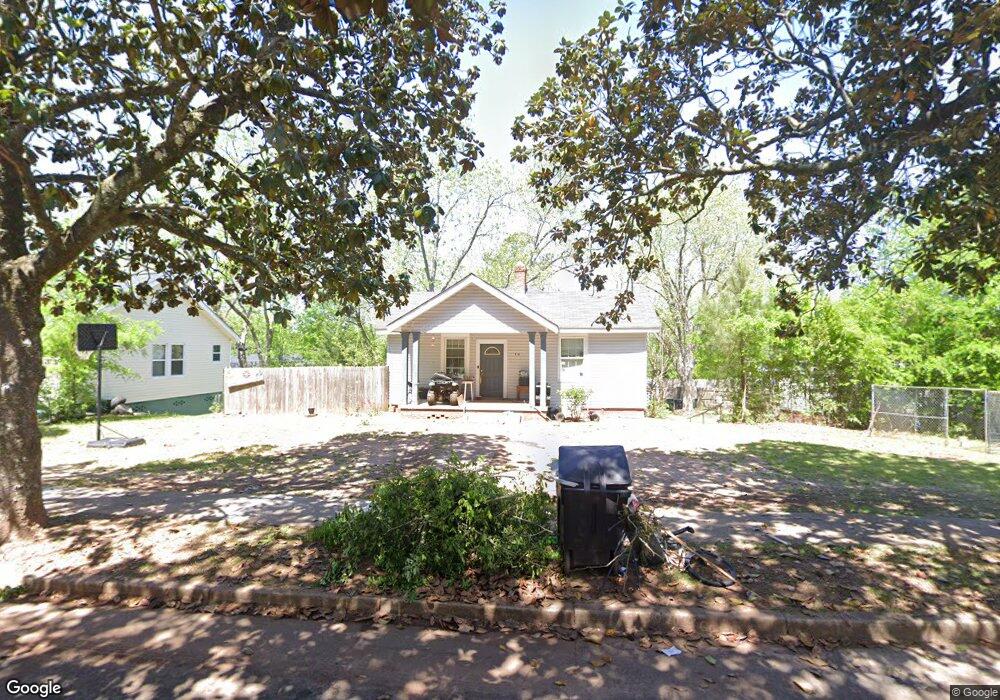
518 11th Ave Thomaston, GA 30286
Estimated Value: $81,000 - $147,000
About This Home
This home is located at 518 11th Ave, Thomaston, GA 30286 and is currently estimated at $113,044, approximately $83 per square foot. 518 11th Ave is a home located in Upson County with nearby schools including Upson-Lee South Elementary School, Upson-Lee North Elementary School, and Upson-Lee Middle School.
Ownership History
We collect this data history from publicly available records. To have your information removed, we recommend requesting removal directly through your county’s website.
Purchase Details
Purchase Details
Purchase Details
Purchase History
We collect this data history from publicly available records. To have your information removed, we recommend requesting removal directly through your county’s website.
| Date | Buyer | Sale Price | Title Company |
|---|---|---|---|
| -- | -- | ||
| $17,800 | -- | ||
| -- | -- | ||
| $13,600 | -- | ||
| $13,600 | -- |
Tax History
We collect this data history from publicly available records. To have your information removed, we recommend requesting removal directly through your county’s website.
| Year | Tax Paid | Tax Assessment Tax Assessment Total Assessment is a certain percentage of the fair market value that is determined by local assessors to be the total taxable value of land and additions on the property. | Land | Improvement |
|---|---|---|---|---|
| 2025 | $909 | $31,145 | $3,200 | $27,945 |
| 2024 | $909 | $24,389 | $3,200 | $21,189 |
| 2023 | $626 | $23,902 | $3,200 | $20,702 |
| 2022 | $530 | $19,053 | $3,200 | $15,853 |
| 2021 | $521 | $18,288 | $3,200 | $15,088 |
| 2020 | $410 | $13,450 | $3,200 | $10,250 |
| 2019 | $454 | $14,286 | $4,800 | $9,486 |
| 2018 | $454 | $14,286 | $4,800 | $9,486 |
| 2017 | $327 | $9,343 | $1,600 | $7,743 |
| 2016 | $407 | $12,866 | $1,600 | $11,266 |
| 2015 | $398 | $12,701 | $1,600 | $11,101 |
| 2014 | $396 | $12,701 | $1,600 | $11,101 |
Map
- 0 12th Ave Unit 10754792
- 126 B St NE
- 74 E St
- 106 C St NE
- 100 Beaver Run Trace
- 146 N St NW
- 516 W Goodrich Ave
- 119 O St NW
- 524 W Goodrich Ave
- 40 Edgewood Ave
- 101 Pineview Dr
- 108 R St SW
- 100 Third St +2 Others
- 113 Park Ln
- 300 Poplar Dr
- 114 Pinedale St
- 503 N Church St
- 107 Cottage Ct Unit 2A
- 105 Cottage Ct Unit 1B
- 103 Cottage Ct Unit 1A
Ask me questions while you tour the home.