518 Canabra Ct Draper, UT 84020
Estimated Value: $682,000 - $809,000
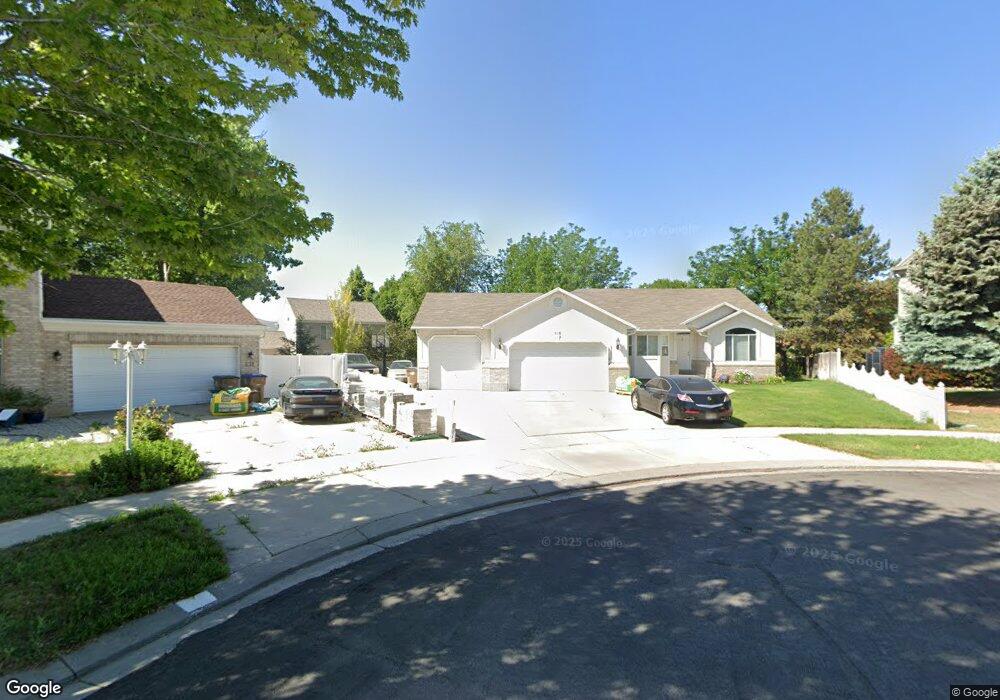
About This Home
This home is located at 518 Canabra Ct, Draper, UT 84020 and is currently estimated at $754,281, approximately $413 per square foot. 518 Canabra Ct is a home located in Salt Lake County with nearby schools including Crescent School, Mount Jordan Middle School, and St John the Baptist Catholic Elementary School.
Ownership History
We collect this data history from publicly available records. To have your information removed, we recommend requesting removal directly through your county’s website.
Purchase Details
Purchase Details
Home Financials for this Owner
Home Financials are based on the most recent Mortgage that was taken out on this home.Purchase Details
Purchase Details
Purchase Details
Home Values in the Area
Average Home Value in this Area
Purchase History
We collect this data history from publicly available records. To have your information removed, we recommend requesting removal directly through your county’s website.
| Date | Buyer | Sale Price | Title Company |
|---|---|---|---|
| -- | None Available | ||
| -- | Sutherland Title | ||
| -- | Sutherland Title | ||
| -- | -- | ||
| -- | -- |
Mortgage History
We collect this data history from publicly available records. To have your information removed, we recommend requesting removal directly through your county’s website.
| Date | Status | Borrower | Loan Amount |
|---|---|---|---|
| Previous Owner | $110,000 |
Tax History
We collect this data history from publicly available records. To have your information removed, we recommend requesting removal directly through your county’s website.
| Year | Tax Paid | Tax Assessment Tax Assessment Total Assessment is a certain percentage of the fair market value that is determined by local assessors to be the total taxable value of land and additions on the property. | Land | Improvement |
|---|---|---|---|---|
| 2025 | $3,586 | $696,000 | $288,900 | $407,100 |
| 2024 | $3,536 | $674,000 | $278,200 | $395,800 |
| 2023 | $3,495 | $661,200 | $258,200 | $403,000 |
| 2022 | $3,666 | $669,800 | $253,100 | $416,700 |
| 2021 | $3,153 | $492,000 | $238,500 | $253,500 |
| 2020 | $3,023 | $447,200 | $209,300 | $237,900 |
| 2019 | $3,015 | $435,800 | $209,300 | $226,500 |
| 2018 | $2,859 | $422,300 | $195,300 | $227,000 |
| 2017 | $2,736 | $387,100 | $185,900 | $201,200 |
| 2016 | $2,696 | $370,700 | $178,500 | $192,200 |
| 2015 | $2,938 | $374,000 | $182,100 | $191,900 |
| 2014 | $2,740 | $340,700 | $167,800 | $172,900 |
Map
- 585 E Wyngate Pointe Ln
- 11738 S Nigel Peak Ln
- 11743 S 700 E
- 252 E Cranberry Hill Dr
- 11344 S Abbotts Ford Ln
- 681 Abbottsford Ct
- 699 E Hillock Ct Unit 16
- 276 E Hidden View Dr Unit 98
- 11873 Cottage View Ln
- 685 E 12000 S
- 11881 Cottage View Ln
- 262 Hidden View Dr Unit 94
- 11870 Cottage View Ln
- 362 E 12000 S
- 8858 S Willow Wood Dr
- 12062 S 540 E
- 11261 S 625 E
- 248 E Crescentwood Dr
- 11423 S 150 E
- 11305 S 265 E Unit 229
- 517 Canabra Ct
- 532 Canabra Ct
- 519 High Berry Ln
- 519 E High Berry Ln
- 507 E High Berry Ln
- 507 High Berry Ln
- 11677 Mapleberry Ct
- 11677 S Mapleberry Ct
- 11689 Mapleberry Ct
- 11689 S Mapleberry Ct
- 523 E Canabra Ct Unit 1
- 523 Canabra Ct
- 531 High Berry Ln
- 531 E High Berry Ln
- 11672 Thornberry Dr
- 11663 Mapleberry Ct
- 493 High Berry Ln
- 493 E High Berry Ln
- 11682 Thornberry Dr
- 11682 S Thornberry Dr
Ask me questions while you tour the home.