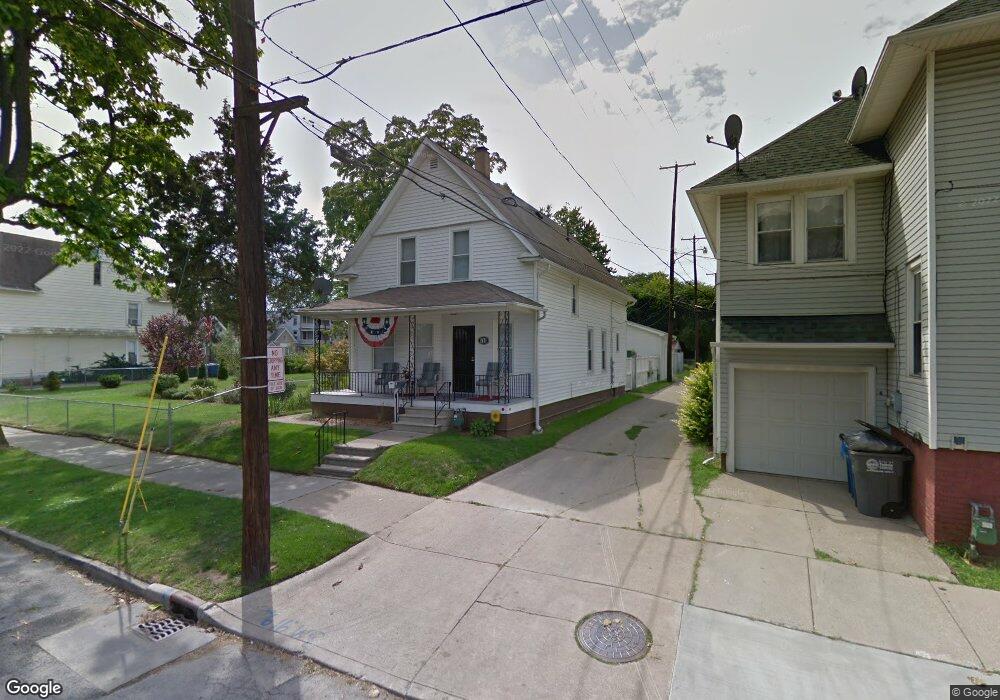
518 Chapin St Toledo, OH 43609
Southside NeighborhoodEstimated Value: $63,000 - $89,000
3
Beds
2
Baths
1,704
Sq Ft
$42/Sq Ft
Est. Value
About This Home
This home is located at 518 Chapin St, Toledo, OH 43609 and is currently estimated at $71,604, approximately $42 per square foot. 518 Chapin St is a home located in Lucas County with nearby schools including Marshall Stemm Academy, Jesup W. Scott High School, and Summit Academy - Toledo.
Ownership History
Date
Name
Owned For
Owner Type
Purchase Details
Closed on
Apr 8, 2020
Sold by
Bond Jessica M
Bought by
Betts Benjamin
Current Estimated Value
Purchase Details
Closed on
Jan 9, 2020
Sold by
Estate Of James Betts
Bought by
Betts Benjamin
Purchase Details
Closed on
Oct 19, 2009
Sold by
Neighborhood Housing Services Of Toledo
Bought by
Betts James C and Bond Jessica M
Purchase Details
Closed on
Oct 16, 2001
Sold by
Maumee Valley Habitat For Humanity
Bought by
Neighborhood Housing Services Of Toledo
Purchase Details
Closed on
Sep 29, 2001
Sold by
Mathre Bonnie J
Bought by
Maumee Valley Habitat For Humanity
Create a Home Valuation Report for This Property
The Home Valuation Report is an in-depth analysis detailing your home's value as well as a comparison with similar homes in the area
Home Values in the Area
Average Home Value in this Area
Purchase History
| Date | Buyer | Sale Price | Title Company |
|---|---|---|---|
| Betts Benjamin | $25,000 | None Available | |
| Betts Benjamin | -- | None Available | |
| Betts James C | $5,000 | None Available | |
| Neighborhood Housing Services Of Toledo | $12,000 | -- | |
| Maumee Valley Habitat For Humanity | $20,000 | -- |
Source: Public Records
Tax History Compared to Growth
Tax History
| Year | Tax Paid | Tax Assessment Tax Assessment Total Assessment is a certain percentage of the fair market value that is determined by local assessors to be the total taxable value of land and additions on the property. | Land | Improvement |
|---|---|---|---|---|
| 2024 | $380 | $15,365 | $2,450 | $12,915 |
| 2023 | $575 | $11,620 | $2,100 | $9,520 |
| 2022 | $1,119 | $11,620 | $2,100 | $9,520 |
| 2021 | $406 | $11,620 | $2,100 | $9,520 |
| 2020 | $447 | $11,060 | $2,030 | $9,030 |
| 2019 | $440 | $11,060 | $2,030 | $9,030 |
| 2018 | $431 | $11,060 | $2,030 | $9,030 |
| 2017 | $440 | $10,430 | $2,100 | $8,330 |
| 2016 | $277 | $29,200 | $5,400 | $23,800 |
| 2015 | $363 | $29,200 | $5,400 | $23,800 |
| 2014 | $661 | $10,220 | $1,890 | $8,330 |
| 2013 | $661 | $10,220 | $1,890 | $8,330 |
Source: Public Records
Map
Nearby Homes