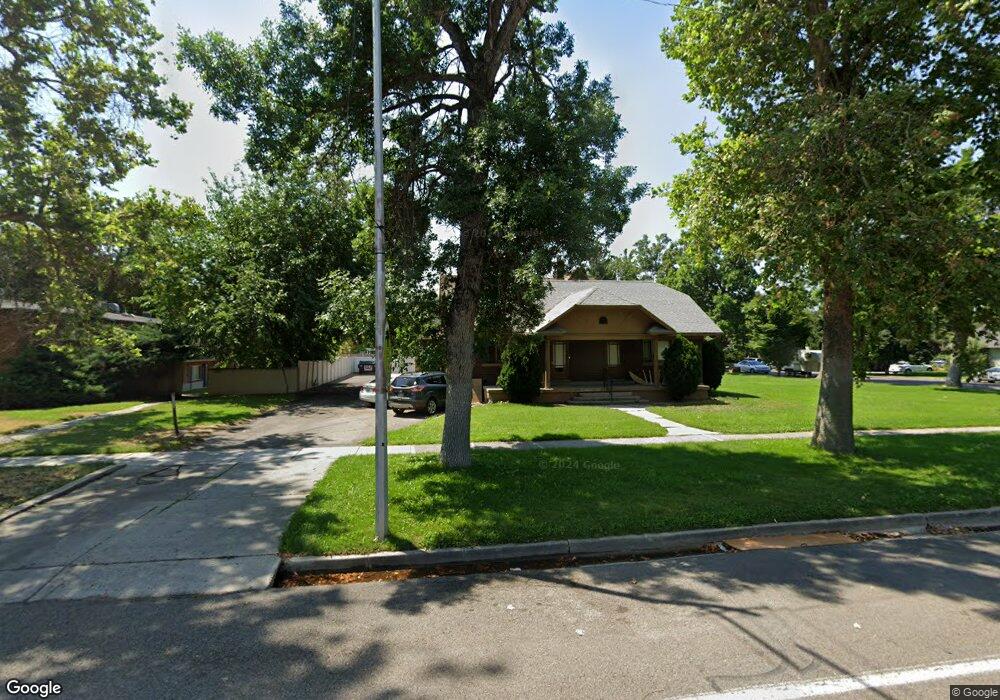
518 E Center St Provo, UT 84606
Joaquin NeighborhoodEstimated Value: $507,920 - $603,000
3
Beds
3
Baths
2,349
Sq Ft
$237/Sq Ft
Est. Value
About This Home
This home is located at 518 E Center St, Provo, UT 84606 and is currently estimated at $557,307, approximately $237 per square foot. 518 E Center St is a home located in Utah County with nearby schools including Provo Peaks School, Centennial Middle School, and Timpview High School.
Ownership History
Date
Name
Owned For
Owner Type
Purchase Details
Closed on
Dec 16, 2013
Sold by
Nielsen Craig C
Bought by
Ccn2 Llc
Current Estimated Value
Purchase Details
Closed on
Dec 15, 2008
Sold by
Nielsen Craig C
Bought by
Nielsen Craig C
Home Financials for this Owner
Home Financials are based on the most recent Mortgage that was taken out on this home.
Original Mortgage
$791,000
Interest Rate
6.47%
Mortgage Type
Commercial
Purchase Details
Closed on
Apr 6, 2006
Sold by
Nielsen Craig C
Bought by
Nielsen Graig C
Create a Home Valuation Report for This Property
The Home Valuation Report is an in-depth analysis detailing your home's value as well as a comparison with similar homes in the area
Home Values in the Area
Average Home Value in this Area
Purchase History
| Date | Buyer | Sale Price | Title Company |
|---|---|---|---|
| Ccn2 Llc | -- | None Available | |
| Nielsen Craig C | -- | Affiliated First Title Comp | |
| Nielsen Craig C | -- | Affiliated First Title Comp | |
| Nielsen Graig C | -- | Accommodation |
Source: Public Records
Mortgage History
| Date | Status | Borrower | Loan Amount |
|---|---|---|---|
| Previous Owner | Nielsen Craig C | $791,000 |
Source: Public Records
Tax History
| Year | Tax Paid | Tax Assessment Tax Assessment Total Assessment is a certain percentage of the fair market value that is determined by local assessors to be the total taxable value of land and additions on the property. | Land | Improvement |
|---|---|---|---|---|
| 2025 | $1,871 | $214,445 | -- | -- |
| 2024 | $1,871 | $184,140 | $0 | $0 |
| 2023 | $1,879 | $182,325 | $0 | $0 |
| 2022 | $1,775 | $173,635 | $0 | $0 |
| 2021 | $1,480 | $252,500 | $118,400 | $134,100 |
| 2020 | $1,653 | $264,500 | $105,800 | $158,700 |
| 2019 | $1,513 | $251,800 | $124,500 | $127,300 |
| 2018 | $1,388 | $234,200 | $109,800 | $124,400 |
| 2017 | $1,188 | $110,110 | $0 | $0 |
| 2016 | $1,158 | $128,480 | $0 | $0 |
| 2015 | $1,337 | $116,820 | $0 | $0 |
| 2014 | $1,148 | $104,500 | $0 | $0 |
Source: Public Records
Map
Nearby Homes
Your Personal Tour Guide
Ask me questions while you tour the home.