
Seller's Agent in 2020
Callie Hughey-Walker
Hughey & Neuman, Inc.
(229) 344-5261
6 in this area
278 Total Sales
Estimated Value: $165,000 - $181,000
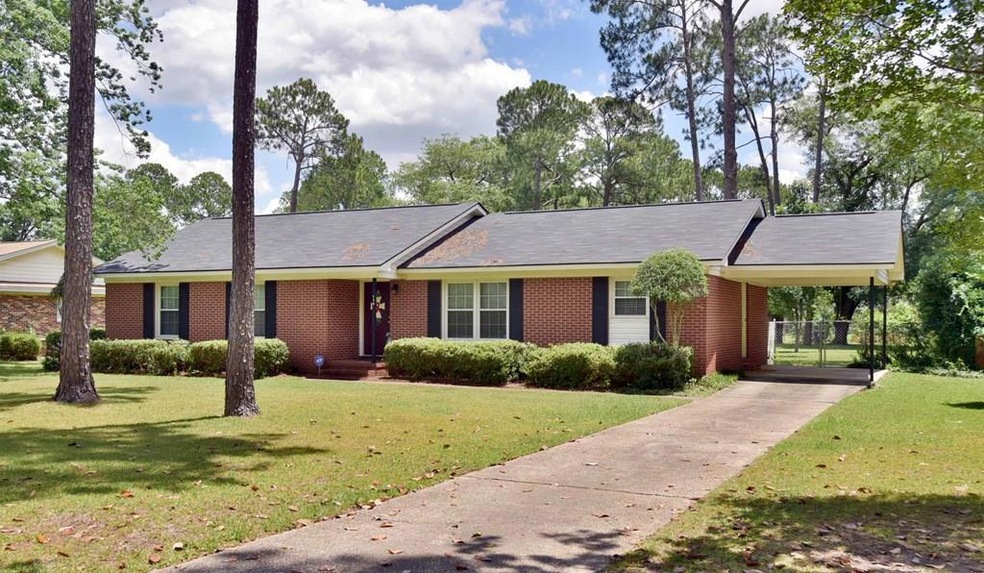
COMPLETELY UPDATED! There are so many reasons why this house is perfect for you! 1) Close to schools and churches! 2) Fenced backyard (6ft height) with wired workshop! 3.) NEW & IMPROVED Open Concept Living areas with dining and family room. This space features fireplace with raised hearth, updated engineered hardwood flooring, neutral paint colors, updated lighting and fixtures, crown molding and access to screen porch- WOW! 4.) AMAZING Kitchen featuring granite countertops, pantry, breakfast bar, updated sink faucet, garbage disposal, decorative tile flooring in herringbone pattern & eat-in breakfast room with bay window!! 5.) Updated guest bathroom with new cabinets, built in storage, granite countertops, tiled tub/shower, new plumbing and light fixtures and ceramic tile flooring 6.) Two Guest bedrooms have updated flooring, crown molding, lighted closets, new fixtures and neutral paint colors 7.) Master Suite w/ double closet & Spa Quality Bathroom 7.) Master Bathroom- Beautiful Tiled shower, vanity with granite countertop, tiled flooring, updated plumbing and light fixtures 8.) SPACIOUS Screen porch with tiled floor- a GREAT extension of your inside living space 9.) Roof replaced in 2017 10.) Termite Bond with Adams 11.) 2" window blinds throughout 12.) Quiet Street with very little traffic & covered parking! This move in ready home is READY for you! Call today!
Last Agent to Sell the Property
Hughey & Neuman, Inc. Brokerage Phone: 2294360212 License #335543 Listed on: 06/08/2020
| Date | Buyer | Sale Price | Title Company |
|---|---|---|---|
| Malone Ward Tiffany A | $123,000 | -- | |
| Heredeen Francis | $132,500 | -- | |
| Heredeen Francis | $132,500 | -- | |
| Frasier Randolph C | -- | -- | |
| Dsddfuy | -- | -- |
| Date | Status | Borrower | Loan Amount |
|---|---|---|---|
| Previous Owner | Heredeen Francis | $135,348 |
| Date | Event | Price | List to Sale | Price per Sq Ft |
|---|---|---|---|---|
| 06/15/2020 06/15/20 | Sold | $123,000 | -- | $76 / Sq Ft |
| 06/08/2020 06/08/20 | Pending | -- | -- | -- |
| Year | Tax Paid | Tax Assessment Tax Assessment Total Assessment is a certain percentage of the fair market value that is determined by local assessors to be the total taxable value of land and additions on the property. | Land | Improvement |
|---|---|---|---|---|
| 2024 | $2,177 | $47,640 | $7,400 | $40,240 |
| 2023 | $1,288 | $47,640 | $7,400 | $40,240 |
| 2022 | $2,134 | $47,640 | $7,400 | $40,240 |
| 2021 | $1,979 | $47,640 | $7,400 | $40,240 |
| 2020 | $1,983 | $47,640 | $7,400 | $40,240 |
| 2019 | $1,991 | $47,640 | $7,400 | $40,240 |
| 2018 | $1,999 | $47,640 | $7,400 | $40,240 |
| 2017 | $1,862 | $47,640 | $7,400 | $40,240 |
| 2016 | $1,863 | $47,640 | $7,400 | $40,240 |
| 2015 | $1,869 | $47,640 | $7,400 | $40,240 |
| 2014 | $1,845 | $47,640 | $7,400 | $40,240 |
Seller's Agent in 2020
Callie Hughey-Walker
Hughey & Neuman, Inc.
(229) 344-5261
6 in this area
278 Total Sales
Buyer's Agent in 2020
RaShaunda L. Muldrow
The Real Estate Concierge LLC
(229) 291-0831
3 in this area
132 Total Sales
Source: Albany Board of REALTORS®
MLS Number: 145266
APN: 000GG-00023-003