518 Holtsford St Lawrenceburg, TN 38464
Estimated Value: $107,493
--
Bed
--
Bath
5,000
Sq Ft
$21/Sq Ft
Est. Value
About This Home
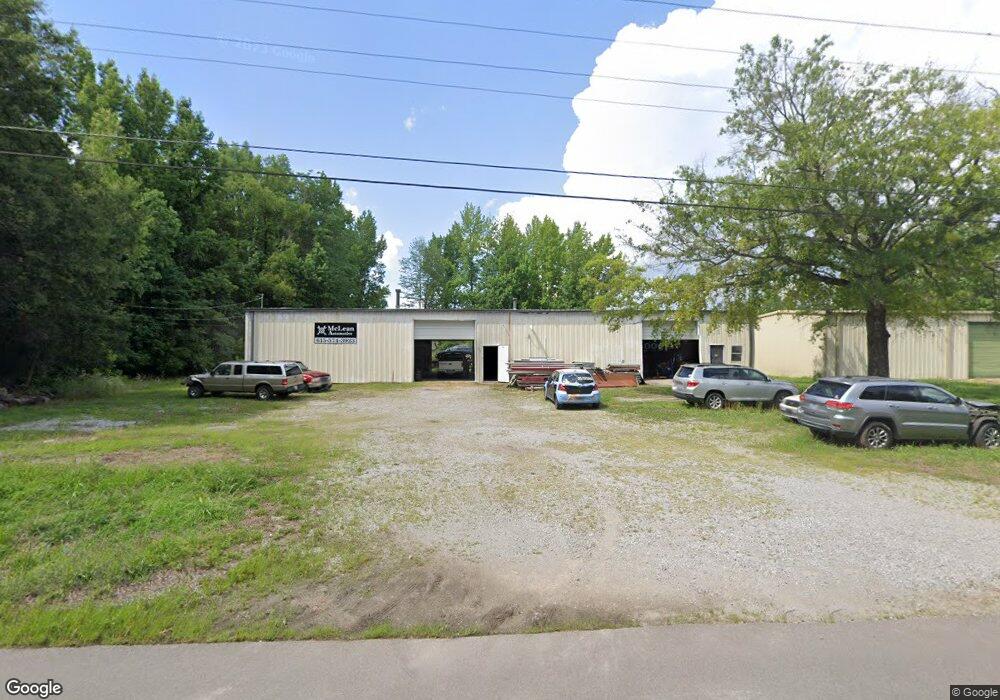
This home is located at 518 Holtsford St, Lawrenceburg, TN 38464 and is currently estimated at $107,493, approximately $21 per square foot. 518 Holtsford St is a home located in Lawrence County with nearby schools including Ingram Sowell Elementary School, David Crockett Elementary School, and Lawrenceburg Public Elementary School.
Ownership History
Date
Name
Owned For
Owner Type
Purchase Details
Closed on
Jun 2, 2022
Sold by
Mclean Blake O
Bought by
Mclean Blake O and Mclean Abigail R
Current Estimated Value
Home Financials for this Owner
Home Financials are based on the most recent Mortgage that was taken out on this home.
Original Mortgage
$80,000
Outstanding Balance
$74,201
Interest Rate
5.09%
Mortgage Type
New Conventional
Estimated Equity
$33,292
Purchase Details
Closed on
Jan 17, 2019
Sold by
Saliba Steve
Bought by
Mclean Blake O and Barnard Harold A
Home Financials for this Owner
Home Financials are based on the most recent Mortgage that was taken out on this home.
Original Mortgage
$48,000
Interest Rate
4.7%
Mortgage Type
Commercial
Purchase Details
Closed on
Jan 31, 2017
Sold by
Sds Properties Llc
Bought by
Saliba Steve
Purchase Details
Closed on
May 7, 2008
Sold by
The Frank Baggett Family P
Bought by
Sds Properties Llc
Purchase Details
Closed on
Jun 3, 1977
Bought by
Baggett Frank and Baggett Freda
Create a Home Valuation Report for This Property
The Home Valuation Report is an in-depth analysis detailing your home's value as well as a comparison with similar homes in the area
Home Values in the Area
Average Home Value in this Area
Purchase History
| Date | Buyer | Sale Price | Title Company |
|---|---|---|---|
| Mclean Blake O | -- | Benjamin William N | |
| Mclean Blake O | $60,000 | Warranty Title Insurance Co | |
| Saliba Steve | -- | -- | |
| Sds Properties Llc | $45,000 | -- | |
| Baggett Frank | -- | -- |
Source: Public Records
Mortgage History
| Date | Status | Borrower | Loan Amount |
|---|---|---|---|
| Open | Mclean Blake O | $80,000 | |
| Previous Owner | Mclean Blake O | $48,000 |
Source: Public Records
Tax History Compared to Growth
Tax History
| Year | Tax Paid | Tax Assessment Tax Assessment Total Assessment is a certain percentage of the fair market value that is determined by local assessors to be the total taxable value of land and additions on the property. | Land | Improvement |
|---|---|---|---|---|
| 2025 | $547 | $17,600 | $0 | $0 |
| 2024 | $547 | $17,600 | $6,160 | $11,440 |
| 2023 | $547 | $17,600 | $6,160 | $11,440 |
| 2022 | $547 | $17,600 | $6,160 | $11,440 |
| 2021 | $719 | $16,360 | $6,160 | $10,200 |
| 2020 | $719 | $16,360 | $6,160 | $10,200 |
| 2019 | $719 | $16,360 | $6,160 | $10,200 |
| 2018 | $719 | $16,360 | $6,160 | $10,200 |
| 2017 | $719 | $16,360 | $6,160 | $10,200 |
| 2016 | $719 | $16,360 | $6,160 | $10,200 |
| 2015 | $681 | $16,360 | $6,160 | $10,200 |
| 2014 | $749 | $18,000 | $6,160 | $11,840 |
Source: Public Records
Map
Nearby Homes
- 514 Holtsford St
- 434 Gobble St
- 422 Gobble St
- 436 Gobble St
- 428 Gobble St
- 424 Gobble St
- 432 Gobble St
- 416 Gobble St
- 1414 Triple k Ave
- 1412 Triple k Ave
- 414 Gobble St
- 412 Gobble St
- 1416 Triple k Ave
- 504 Holtsford St
- 1409 Buffalo Rd Units B
- 1409 Buffalo Rd Unit C
- 1409 Buffalo Rd Unit A
- 1411 Buffalo Rd
- 405 Oak St