
Seller's Agent in 2016
John Flor
Keller Williams Realty Diversified~Chetek
(715) 205-3776
383 Total Sales
Estimated Value: $125,000 - $173,000
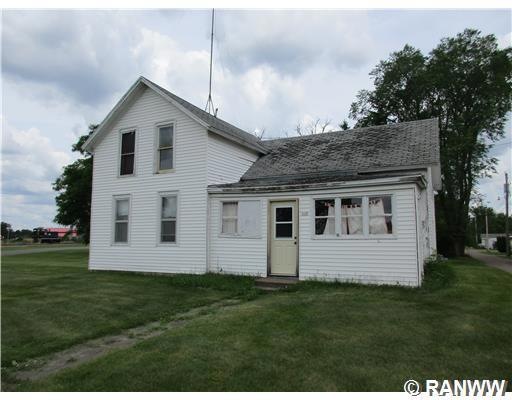
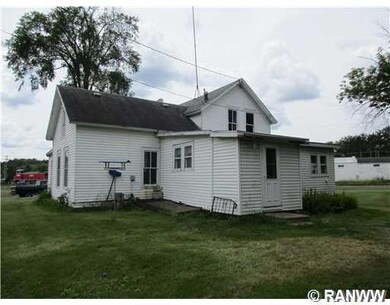
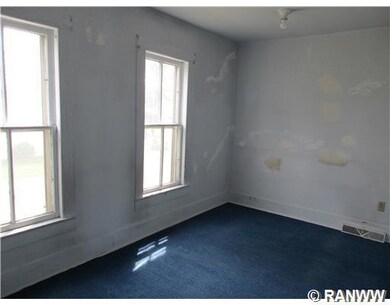
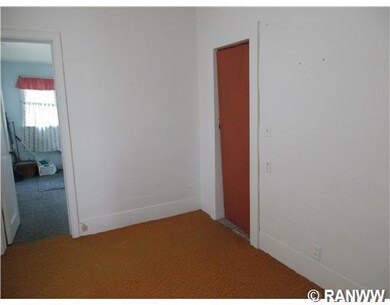
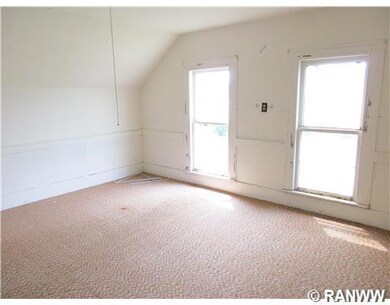
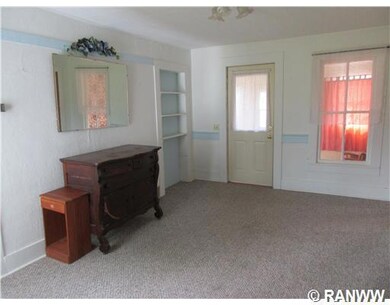
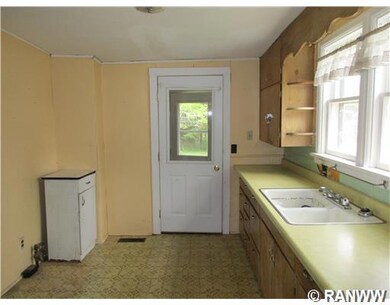
Handyman special! This classic home in the heart of Chetek needs your help in returning to its former glory. The property is located within walking distance of both schools and downtown conveniences. The property has been used as a rental in the past, so if you are looking to invest in real estate, this could be an inexpensive addition to your portfolio.
| Date | Buyer | Sale Price | Title Company |
|---|---|---|---|
| Hallquist John G | $35,000 | -- | |
| Hallquist John G | $35,000 | -- | |
| Brown Janet K | $30,000 | -- |
| Date | Event | Price | List to Sale | Price per Sq Ft |
|---|---|---|---|---|
| 05/20/2016 05/20/16 | Sold | $30,000 | -24.8% | $18 / Sq Ft |
| 04/20/2016 04/20/16 | Pending | -- | -- | -- |
| 06/23/2015 06/23/15 | For Sale | $39,900 | -- | $24 / Sq Ft |
| Year | Tax Paid | Tax Assessment Tax Assessment Total Assessment is a certain percentage of the fair market value that is determined by local assessors to be the total taxable value of land and additions on the property. | Land | Improvement |
|---|---|---|---|---|
| 2025 | $688 | $46,800 | $11,400 | $35,400 |
| 2024 | $640 | $46,800 | $11,400 | $35,400 |
| 2023 | $492 | $46,800 | $11,400 | $35,400 |
| 2022 | $542 | $46,800 | $11,400 | $35,400 |
| 2021 | $574 | $35,300 | $8,600 | $26,700 |
| 2020 | $661 | $35,300 | $8,600 | $26,700 |
| 2019 | $608 | $35,300 | $8,600 | $26,700 |
| 2018 | $686 | $35,300 | $8,600 | $26,700 |
| 2017 | $678 | $35,300 | $8,600 | $26,700 |
| 2016 | $1,146 | $49,000 | $8,600 | $40,400 |
| 2015 | $1,086 | $49,000 | $8,600 | $40,400 |
| 2014 | $1,130 | $49,000 | $8,600 | $40,400 |
| 2013 | $1,130 | $49,000 | $8,600 | $40,400 |
Seller's Agent in 2016
John Flor
Keller Williams Realty Diversified~Chetek
(715) 205-3776
383 Total Sales
Source: Northwestern Wisconsin Multiple Listing Service
MLS Number: 891538
APN: 211-1067-50-000
Disclaimer: Certain information contained herein is derived from information provided by parties other than Homes.com. All information provided is deemed reliable, but is not guaranteed to be accurate and should be independently verified.
![]() IDX information is provided exclusively for personal, non-commercial use, and may not be used for any purpose other than to identify prospective properties consumers may be interested in purchasing. Information is deemed reliable but not guaranteed.
IDX information is provided exclusively for personal, non-commercial use, and may not be used for any purpose other than to identify prospective properties consumers may be interested in purchasing. Information is deemed reliable but not guaranteed.
Ask me questions while you tour the home.