518 Via de la Valle Unit 518 Solana Beach, CA 92075
Estimated Value: $867,000 - $1,231,000
1
Bed
1
Bath
860
Sq Ft
$1,124/Sq Ft
Est. Value
About This Home
This home is located at 518 Via de la Valle Unit 518, Solana Beach, CA 92075 and is currently estimated at $966,275, approximately $1,123 per square foot. 518 Via de la Valle Unit 518 is a home located in San Diego County with nearby schools including Skyline Elementary School, Solana Vista Elementary School, and Earl Warren Middle School.
Ownership History
Date
Name
Owned For
Owner Type
Purchase Details
Closed on
Sep 12, 2018
Sold by
Lutz Donna T
Bought by
Bisson Scott
Current Estimated Value
Home Financials for this Owner
Home Financials are based on the most recent Mortgage that was taken out on this home.
Original Mortgage
$482,240
Outstanding Balance
$419,676
Interest Rate
4.5%
Mortgage Type
New Conventional
Estimated Equity
$546,599
Purchase Details
Closed on
Apr 27, 2017
Sold by
Lutz Donna Therese
Bought by
Lutz Donna T
Purchase Details
Closed on
Nov 27, 2013
Sold by
Furrows Jean
Bought by
Starfish Investments Trust
Purchase Details
Closed on
Sep 30, 2013
Sold by
Lutz Donna Therese
Bought by
Furrows Jean
Purchase Details
Closed on
Aug 5, 1986
Create a Home Valuation Report for This Property
The Home Valuation Report is an in-depth analysis detailing your home's value as well as a comparison with similar homes in the area
Home Values in the Area
Average Home Value in this Area
Purchase History
| Date | Buyer | Sale Price | Title Company |
|---|---|---|---|
| Bisson Scott | $603,000 | Chicago Title Company | |
| Lutz Donna T | -- | None Available | |
| Lutz Donna Therese | -- | None Available | |
| Starfish Investments Trust | -- | None Available | |
| Furrows Jean | -- | None Available | |
| -- | $94,900 | -- |
Source: Public Records
Mortgage History
| Date | Status | Borrower | Loan Amount |
|---|---|---|---|
| Open | Bisson Scott | $482,240 |
Source: Public Records
Tax History Compared to Growth
Tax History
| Year | Tax Paid | Tax Assessment Tax Assessment Total Assessment is a certain percentage of the fair market value that is determined by local assessors to be the total taxable value of land and additions on the property. | Land | Improvement |
|---|---|---|---|---|
| 2025 | $7,766 | $672,429 | $320,205 | $352,224 |
| 2024 | $7,766 | $659,245 | $313,927 | $345,318 |
| 2023 | $7,612 | $646,320 | $307,772 | $338,548 |
| 2022 | $7,501 | $633,648 | $301,738 | $331,910 |
| 2021 | $7,380 | $621,224 | $295,822 | $325,402 |
| 2020 | $7,322 | $614,855 | $292,789 | $322,066 |
| 2019 | $7,194 | $602,800 | $287,049 | $315,751 |
| 2018 | $2,473 | $162,119 | $77,200 | $84,919 |
| 2017 | $2,427 | $158,941 | $75,687 | $83,254 |
| 2016 | $2,307 | $155,825 | $74,203 | $81,622 |
| 2015 | $4,095 | $331,493 | $244,795 | $86,698 |
| 2014 | $4,010 | $325,000 | $240,000 | $85,000 |
Source: Public Records
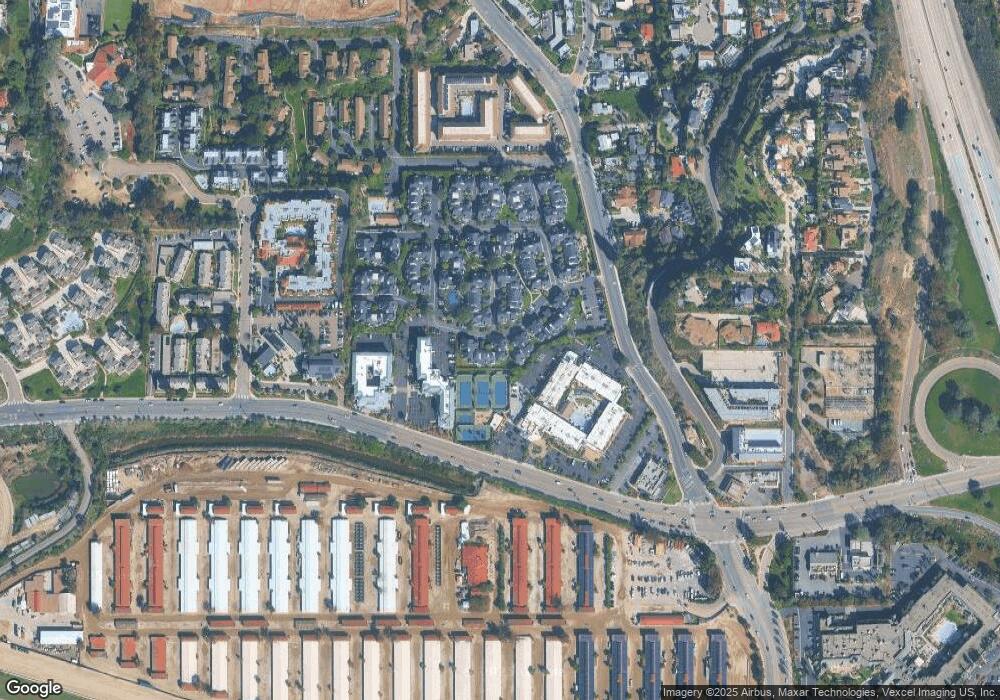
Map
Nearby Homes
- 524 Via de la Valle Unit H
- 526 Via de la Valle Unit A
- 528 Via de la Valle Unit H
- 827 Del Mar Downs Rd Unit E
- 818 Viva Ct
- 773 E Solana Cir
- 825 Gonzales St
- 219 Turf View Dr Unit 30
- 811 Highland Dr
- 121 Via de la Valle
- 876 Cofair Ct
- Plan 5 at Drift
- Plan 2 at Drift
- Plan 1 at Drift
- Plan 3 at Drift
- Plan 4 at Drift
- 834 S Cedros Ave
- 701 Valley Ave
- 1035 Reliance Way
- 602 Fresca St
- 518 Via de la Valle
- 518 Via de la Valle Unit 518
- 518 Via de la Valle Unit J
- 518 Via de la Valle Unit H
- 518 Via de la Valle Unit E
- 518 Via de la Valle Unit C
- 518 Via de la Valle Unit A
- 518 Via de la Valle Unit I
- 518 Via de la Valle Unit G
- 518 Via de la Valle Unit F
- 518 Via de la Valle Unit D
- 518 Via de la Valle Unit B
- 518 Via de la Valle Unit 12C
- 518 Via de la Valle Unit K
- 536 Via de la Valle
- 522 Via de la Valle Unit D
- 5181/2 Via de la Valle Unit C
- 536 Via de la Valle
- 520 Via de la Valle
- 520 Via de la Valle Unit F