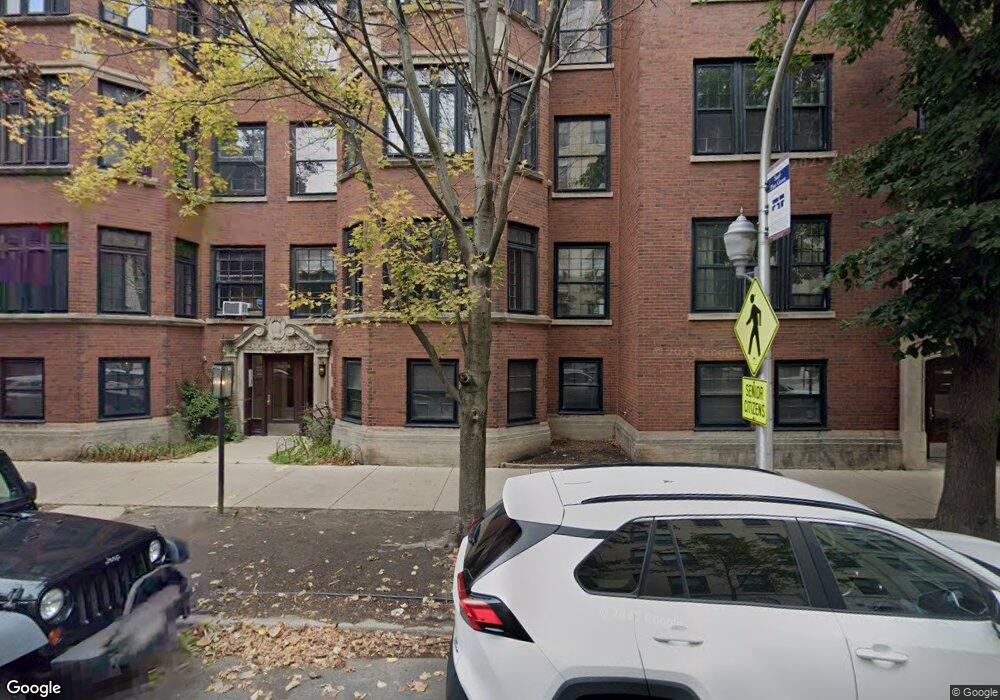
518 W Surf St Unit 2W Chicago, IL 60657
Lakeview East NeighborhoodEstimated Value: $457,000 - $658,000
2
Beds
2
Baths
1,750
Sq Ft
$316/Sq Ft
Est. Value
About This Home
This home is located at 518 W Surf St Unit 2W, Chicago, IL 60657 and is currently estimated at $553,221, approximately $316 per square foot. 518 W Surf St Unit 2W is a home located in Cook County with nearby schools including Nettelhorst Elementary School, Lake View High School, and Saint Clement School.
Ownership History
Date
Name
Owned For
Owner Type
Purchase Details
Closed on
Jan 31, 2008
Sold by
Winston Sarah H
Bought by
Runke James A and Runke Joanne M
Current Estimated Value
Home Financials for this Owner
Home Financials are based on the most recent Mortgage that was taken out on this home.
Original Mortgage
$313,600
Outstanding Balance
$199,254
Interest Rate
6.2%
Mortgage Type
Unknown
Estimated Equity
$353,967
Purchase Details
Closed on
Nov 12, 2002
Sold by
Mcmullen David B and Mcmullen David B
Bought by
Winston Sarah H
Home Financials for this Owner
Home Financials are based on the most recent Mortgage that was taken out on this home.
Original Mortgage
$308,000
Interest Rate
5.25%
Mortgage Type
Unknown
Purchase Details
Closed on
Oct 13, 1994
Sold by
Brilliant Neil L and Devine Kathleen K
Bought by
Mcmullen David B
Home Financials for this Owner
Home Financials are based on the most recent Mortgage that was taken out on this home.
Original Mortgage
$189,000
Interest Rate
6.25%
Create a Home Valuation Report for This Property
The Home Valuation Report is an in-depth analysis detailing your home's value as well as a comparison with similar homes in the area
Home Values in the Area
Average Home Value in this Area
Purchase History
| Date | Buyer | Sale Price | Title Company |
|---|---|---|---|
| Runke James A | $392,000 | Cti | |
| Winston Sarah H | $385,000 | -- | |
| Mcmullen David B | $210,000 | -- |
Source: Public Records
Mortgage History
| Date | Status | Borrower | Loan Amount |
|---|---|---|---|
| Open | Runke James A | $313,600 | |
| Previous Owner | Winston Sarah H | $308,000 | |
| Previous Owner | Mcmullen David B | $189,000 | |
| Closed | Winston Sarah H | $38,500 |
Source: Public Records
Tax History Compared to Growth
Tax History
| Year | Tax Paid | Tax Assessment Tax Assessment Total Assessment is a certain percentage of the fair market value that is determined by local assessors to be the total taxable value of land and additions on the property. | Land | Improvement |
|---|---|---|---|---|
| 2024 | $8,186 | $46,481 | $9,906 | $36,575 |
| 2023 | $7,958 | $42,113 | $7,988 | $34,125 |
| 2022 | $7,958 | $42,113 | $7,988 | $34,125 |
| 2021 | $7,799 | $42,112 | $7,988 | $34,124 |
| 2020 | $6,928 | $34,204 | $5,272 | $28,932 |
| 2019 | $6,838 | $37,463 | $5,272 | $32,191 |
| 2018 | $6,722 | $37,463 | $5,272 | $32,191 |
| 2017 | $6,094 | $31,685 | $4,633 | $27,052 |
| 2016 | $5,846 | $31,685 | $4,633 | $27,052 |
| 2015 | $5,325 | $31,685 | $4,633 | $27,052 |
| 2014 | $5,134 | $30,241 | $3,794 | $26,447 |
| 2013 | $5,022 | $30,241 | $3,794 | $26,447 |
Source: Public Records
Map
Nearby Homes
- 2800 N Pine Grove Ave Unit 8A
- 435 W Surf St Unit 4A
- 550 W Surf St Unit 115
- 550 W Surf St Unit 316
- 2773 N Hampden Ct Unit PH03
- 2773 N Hampden Ct Unit 401
- 415 W Surf St
- 431 W Oakdale Ave Unit 10D
- 2754 N Hampden Ct Unit 506
- 2930 N Sheridan Rd Unit 302
- 2729 N Hampden Ct
- 2726 N Pine Grove Ave Unit 2726
- 2909 N Sheridan Rd Unit 908
- 2728 N Hampden Ct Unit 109
- 2728 N Hampden Ct Unit 605
- 2728 N Hampden Ct Unit 1310
- 2728 N Hampden Ct Unit 301
- 340 W Diversey Pkwy Unit 1616
- 340 W Diversey Pkwy Unit 518
- 340 W Diversey Pkwy Unit 2718
- 516 W Surf St Unit 5161
- 516 W Surf St Unit 5163
- 516 W Surf St Unit 5162
- 516 W Surf St Unit 1
- 516 W Surf St Unit 2
- 2910 N Pine Grove Ave Unit 2910
- 2910 N Pine Grove Ave Unit 2910
- 2910 N Pine Grove Ave Unit 2910
- 2910 N Pine Grove Ave Unit 2
- 2910 N Pine Grove Ave Unit 1
- 518 W Surf St Unit 5183
- 518 W Surf St Unit 5181
- 518 W Surf St Unit 3W
- 518 W Surf St Unit 1
- 510 W Surf St Unit 3
- 510 W Surf St Unit 5101
- 510 W Surf St Unit 5103
- 510 W Surf St Unit 1
- 510 W Surf St
- 510 W Surf St Unit B