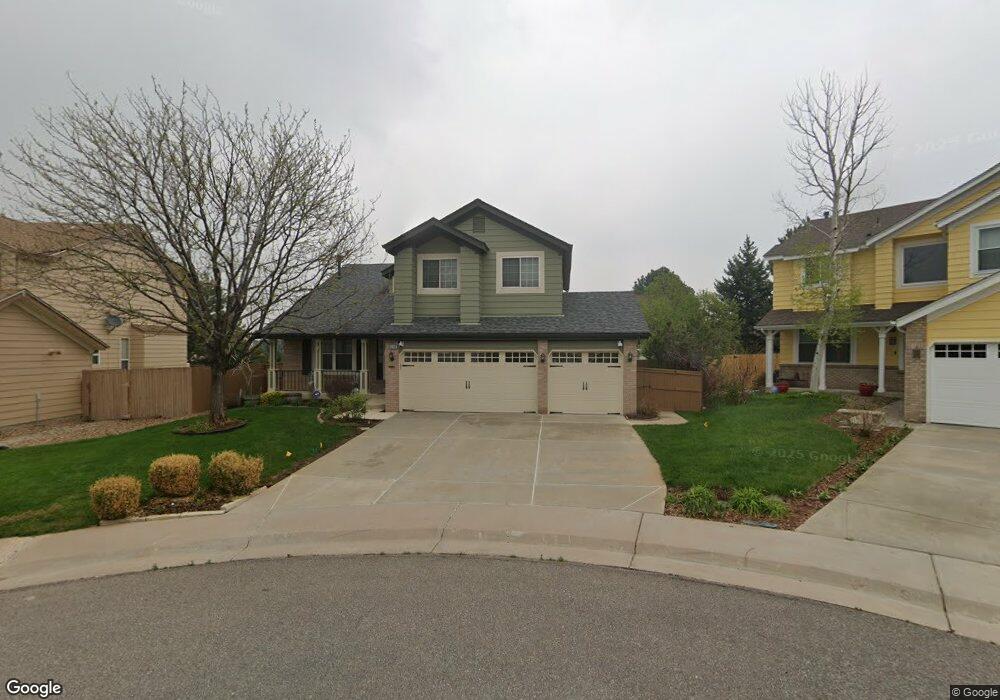
5180 S Genoa Ct Centennial, CO 80015
Smoky Ridge NeighborhoodEstimated Value: $572,529 - $608,000
3
Beds
5
Baths
2,146
Sq Ft
$278/Sq Ft
Est. Value
About This Home
This home is located at 5180 S Genoa Ct, Centennial, CO 80015 and is currently estimated at $596,882, approximately $278 per square foot. 5180 S Genoa Ct is a home located in Arapahoe County with nearby schools including Peakview Elementary School, Thunder Ridge Middle School, and Eaglecrest High School.
Ownership History
Date
Name
Owned For
Owner Type
Purchase Details
Closed on
Jan 24, 2025
Sold by
Allen Vernell C
Bought by
Allen Vernell C and Allen Natasha
Current Estimated Value
Purchase Details
Closed on
Mar 4, 1994
Sold by
Kdb Homes Inc
Bought by
Allen Vernell C and Allen Cheryl L
Home Financials for this Owner
Home Financials are based on the most recent Mortgage that was taken out on this home.
Original Mortgage
$141,750
Interest Rate
7%
Purchase Details
Closed on
Nov 2, 1992
Sold by
Johnson Development Co
Bought by
K D B Homes Inc
Purchase Details
Closed on
Oct 8, 1991
Sold by
Conversion Arapco
Bought by
Johnson Development Co
Purchase Details
Closed on
Jan 1, 1985
Sold by
Conversion Arapco
Bought by
Conversion Arapco
Purchase Details
Closed on
Dec 1, 1983
Bought by
Conversion Arapco
Create a Home Valuation Report for This Property
The Home Valuation Report is an in-depth analysis detailing your home's value as well as a comparison with similar homes in the area
Home Values in the Area
Average Home Value in this Area
Purchase History
| Date | Buyer | Sale Price | Title Company |
|---|---|---|---|
| Allen Vernell C | -- | None Listed On Document | |
| Allen Vernell C | -- | None Listed On Document | |
| Allen Vernell C | $157,517 | -- | |
| K D B Homes Inc | -- | -- | |
| Johnson Development Co | -- | -- | |
| Conversion Arapco | -- | -- | |
| Conversion Arapco | -- | -- |
Source: Public Records
Mortgage History
| Date | Status | Borrower | Loan Amount |
|---|---|---|---|
| Previous Owner | Allen Vernell C | $141,750 |
Source: Public Records
Tax History
| Year | Tax Paid | Tax Assessment Tax Assessment Total Assessment is a certain percentage of the fair market value that is determined by local assessors to be the total taxable value of land and additions on the property. | Land | Improvement |
|---|---|---|---|---|
| 2025 | $3,477 | $38,625 | -- | -- |
| 2024 | $3,477 | $39,470 | -- | -- |
| 2023 | $3,093 | $39,470 | $0 | $0 |
| 2022 | $2,315 | $29,941 | $0 | $0 |
| 2021 | $2,323 | $29,941 | $0 | $0 |
| 2020 | $2,352 | $30,931 | $0 | $0 |
| 2019 | $2,270 | $30,931 | $0 | $0 |
| 2018 | $2,009 | $25,927 | $0 | $0 |
| 2017 | $1,975 | $25,927 | $0 | $0 |
| 2016 | $1,672 | $22,885 | $0 | $0 |
| 2015 | $1,615 | $22,885 | $0 | $0 |
| 2014 | -- | $19,701 | $0 | $0 |
| 2013 | -- | $20,030 | $0 | $0 |
Source: Public Records
Map
Nearby Homes
- 5254 S Espana St
- 5345 S Flanders Way
- 5333 S Genoa Way
- 5305 S Ireland Way
- 20100 E Prentice Ln
- 19418 E Crestridge Cir
- 5285 S Jebel Way
- 19540 E Crestridge Cir
- 5322 S Danube Ct
- 5218 S Jericho Way
- 4865 S Espana Ln
- 19270 E Progress Ave
- 5238 S Jericho Way
- 19978 E Garden Dr
- 20528 E Grand Ln
- 20004 E Tufts Dr
- 5628 S Ensenada Ct
- 5559 S Killarney St
- 5295 S Liverpool Way
- 18997 E Crestridge Cir
- 5160 S Genoa Ct
- 5190 S Genoa Ct
- 5181 S Gibraltar Ct
- 5171 S Gibraltar Ct
- 5199 S Genoa Ct
- 5150 S Genoa Ct
- 5151 S Gibraltar Ct
- 5191 S Gibraltar Ct
- 5189 S Genoa Ct
- 5159 S Genoa Ct
- 5179 S Genoa Ct
- 5140 S Genoa Ct
- 5141 S Gibraltar Ct
- 5149 S Genoa Ct
- 19901 E Red Fox Ln
- 19902 E Red Fox Ln
- 5202 S Genoa Way
- 5139 S Genoa Ct
- 5213 S Gibraltar Ct
- 5201 S Genoa Way
Your Personal Tour Guide
Ask me questions while you tour the home.