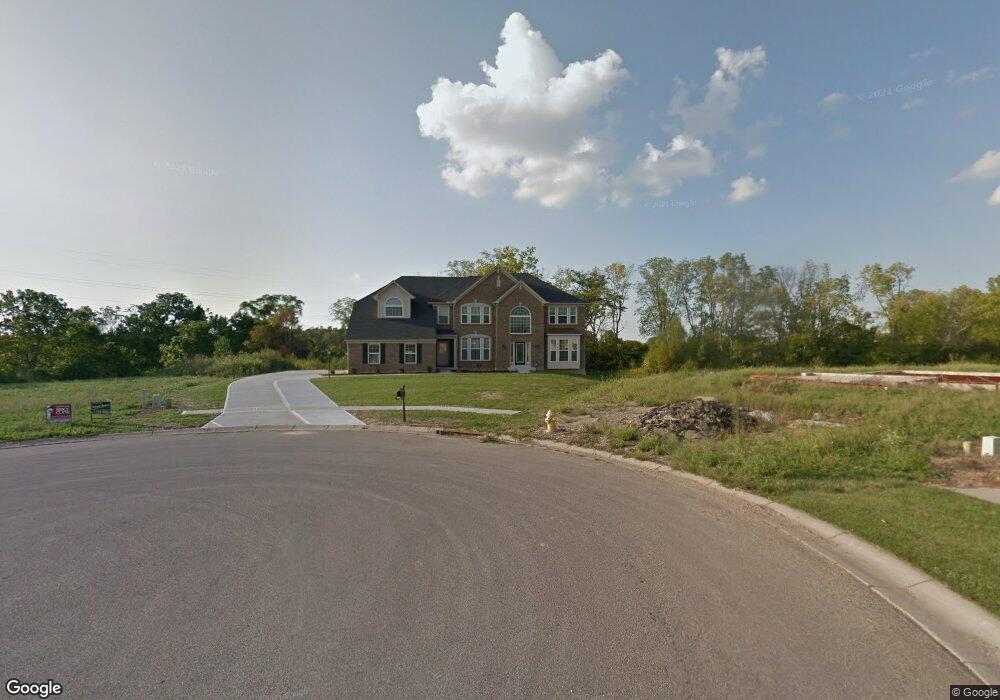
5185 Welney Run Middletown, OH 45044
Estimated Value: $678,000 - $866,000
4
Beds
4
Baths
3,901
Sq Ft
$192/Sq Ft
Est. Value
About This Home
This home is located at 5185 Welney Run, Middletown, OH 45044 and is currently estimated at $750,674, approximately $192 per square foot. 5185 Welney Run is a home located in Butler County with nearby schools including Independence Elementary School, Liberty Junior School, and Lakota East High School.
Ownership History
Date
Name
Owned For
Owner Type
Purchase Details
Closed on
Aug 12, 2021
Sold by
Popov Sergey and Popov Ilona
Bought by
Naidzianovich Siarhei and Orlovskaya Maria
Current Estimated Value
Home Financials for this Owner
Home Financials are based on the most recent Mortgage that was taken out on this home.
Original Mortgage
$300,000
Outstanding Balance
$272,382
Interest Rate
2.8%
Mortgage Type
New Conventional
Estimated Equity
$478,292
Purchase Details
Closed on
May 24, 2011
Sold by
The Drees Company
Bought by
Popov Sergey and Bibik Ilona
Home Financials for this Owner
Home Financials are based on the most recent Mortgage that was taken out on this home.
Original Mortgage
$300,000
Interest Rate
3.99%
Mortgage Type
Purchase Money Mortgage
Purchase Details
Closed on
May 3, 2006
Sold by
Francis Manor Llc
Bought by
The Drees Co
Create a Home Valuation Report for This Property
The Home Valuation Report is an in-depth analysis detailing your home's value as well as a comparison with similar homes in the area
Home Values in the Area
Average Home Value in this Area
Purchase History
| Date | Buyer | Sale Price | Title Company |
|---|---|---|---|
| Naidzianovich Siarhei | $560,000 | Tnta | |
| Popov Sergey | $400,000 | Acs Title & Closing Services | |
| The Drees Co | $228,000 | None Available |
Source: Public Records
Mortgage History
| Date | Status | Borrower | Loan Amount |
|---|---|---|---|
| Open | Naidzianovich Siarhei | $300,000 | |
| Closed | Popov Sergey | $300,000 |
Source: Public Records
Tax History Compared to Growth
Tax History
| Year | Tax Paid | Tax Assessment Tax Assessment Total Assessment is a certain percentage of the fair market value that is determined by local assessors to be the total taxable value of land and additions on the property. | Land | Improvement |
|---|---|---|---|---|
| 2024 | $7,413 | $187,150 | $34,550 | $152,600 |
| 2023 | $7,318 | $180,190 | $34,550 | $145,640 |
| 2022 | $6,764 | $135,410 | $34,550 | $100,860 |
| 2021 | $6,729 | $135,410 | $34,550 | $100,860 |
| 2020 | $6,896 | $135,410 | $34,550 | $100,860 |
| 2019 | $14,889 | $154,560 | $34,460 | $120,100 |
| 2018 | $8,768 | $154,560 | $34,460 | $120,100 |
| 2017 | $8,350 | $146,650 | $34,460 | $112,190 |
| 2016 | $7,760 | $133,950 | $34,460 | $99,490 |
| 2015 | $7,698 | $133,950 | $34,460 | $99,490 |
| 2014 | $8,182 | $133,950 | $34,460 | $99,490 |
| 2013 | $8,182 | $136,060 | $34,460 | $101,600 |
Source: Public Records
Map
Nearby Homes
- 6895 Welney Run
- 5290 Bligh Ct
- 7025 Welney Run
- 6872 Fox Trot Ct
- 7104 Paul Ln
- 5019 Yankee Rd
- 7095 Kyles Station Rd
- 5502 Rodeo Dr
- 7081 Yankee Estates Dr
- 7221 Kyles Station Rd
- 6534 Justess Ln
- 7542 Hickory Knoll Dr
- 6551 Lucky Ln
- 7574 Woodmere Ct
- 5725 Hawthrone Reserve Dr
- 5542 Safari Dr
- 6777 Mahogany Ct
- 5326 Elmwood Ln
- 7377 Burton Dr
- 6466 Winding Oaks Dr
- 17 Welney Run
- 21 Welney Run
- 5195 Welney Run
- 5186 Welney Run
- 5205 Welney Run
- 5196 Welney Run
- 5215 Welney Run
- 5206 Welney Run
- 6962 Francis Dr
- 5225 Welney Run
- 5220 Welney Run
- 6972 Francis Dr
- 6954 Welney Run
- 5236 Welney Run
- 5235 Welney Run
- 6953 Francis Dr
- 6982 Francis Dr
- 6963 Francis Dr
- 6992 Francis Dr
- 6973 Francis Dr