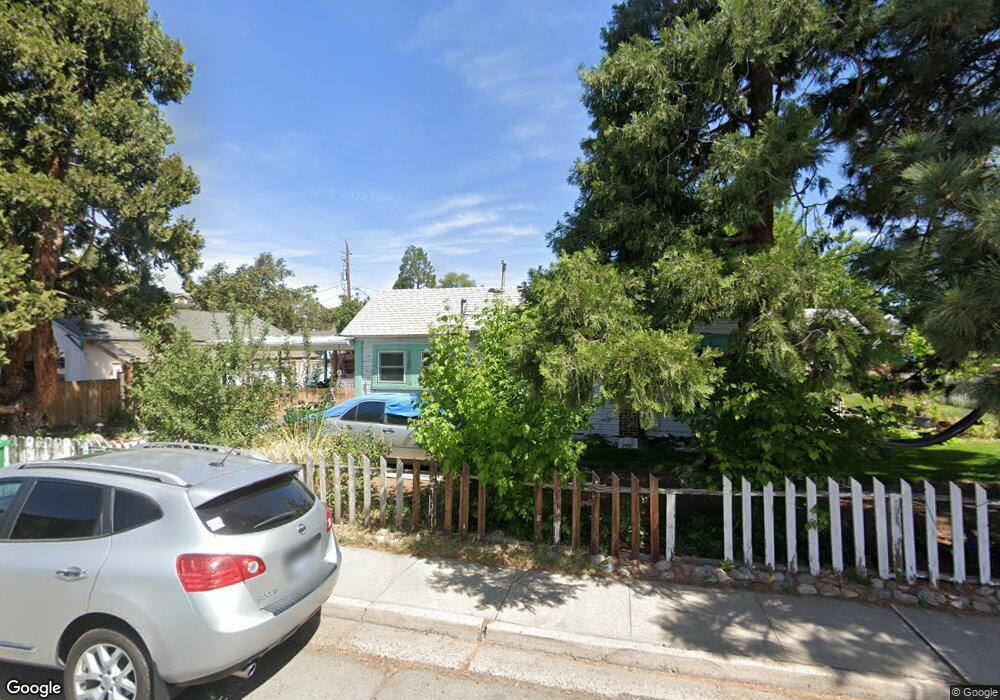
519 18th St Sparks, NV 89431
Downtown Sparks NeighborhoodEstimated Value: $287,000 - $355,170
2
Beds
1
Bath
873
Sq Ft
$368/Sq Ft
Est. Value
About This Home
This home is located at 519 18th St, Sparks, NV 89431 and is currently estimated at $321,057, approximately $367 per square foot. 519 18th St is a home located in Washoe County with nearby schools including Kate M Smith Elementary School, Sparks Middle School, and Sparks High School.
Ownership History
Date
Name
Owned For
Owner Type
Purchase Details
Closed on
Dec 27, 2018
Sold by
Briscoe Annette
Bought by
Briscoe Annette and The Annette Briscoe Trust
Current Estimated Value
Purchase Details
Closed on
May 17, 2017
Sold by
Lau Paul
Bought by
Briscoe Annette
Create a Home Valuation Report for This Property
The Home Valuation Report is an in-depth analysis detailing your home's value as well as a comparison with similar homes in the area
Home Values in the Area
Average Home Value in this Area
Purchase History
| Date | Buyer | Sale Price | Title Company |
|---|---|---|---|
| Briscoe Annette | -- | None Available | |
| Briscoe Annette | $140,000 | Western Title Co |
Source: Public Records
Tax History Compared to Growth
Tax History
| Year | Tax Paid | Tax Assessment Tax Assessment Total Assessment is a certain percentage of the fair market value that is determined by local assessors to be the total taxable value of land and additions on the property. | Land | Improvement |
|---|---|---|---|---|
| 2025 | $608 | $50,112 | $31,675 | $18,437 |
| 2024 | $608 | $46,219 | $27,860 | $18,359 |
| 2023 | $591 | $47,428 | $30,625 | $16,803 |
| 2022 | $578 | $36,379 | $22,680 | $13,699 |
| 2021 | $560 | $29,728 | $16,275 | $13,453 |
| 2020 | $543 | $29,120 | $15,820 | $13,300 |
| 2019 | $515 | $25,914 | $13,615 | $12,299 |
| 2018 | $492 | $20,571 | $10,220 | $10,351 |
| 2017 | $404 | $17,680 | $9,555 | $8,125 |
| 2016 | $394 | $15,502 | $7,420 | $8,082 |
| 2015 | $393 | $13,741 | $5,775 | $7,966 |
| 2014 | $382 | $11,331 | $3,815 | $7,516 |
| 2013 | -- | $10,095 | $2,730 | $7,365 |
Source: Public Records
Map
Nearby Homes
- 1830 C St
- 1811 H St
- 2002 F St
- 2011 H St
- 2100 G St Unit 2
- 972 Flatcar Ln
- 2168 Cannonball Rd
- 987 Damon Ln
- 1841 Merchant St
- 1837 Merchant St
- 1940 Brunetti Way
- 1536 Irene Way
- 1560 Steven Ct Unit 2
- 2380 Roundhouse Rd
- 1527 Steven Ct
- 1229 & 1231 F St
- 2385 Pauline Ave
- 1855 Verano Dr
- 1154 H St
- 1150 El Rancho Dr