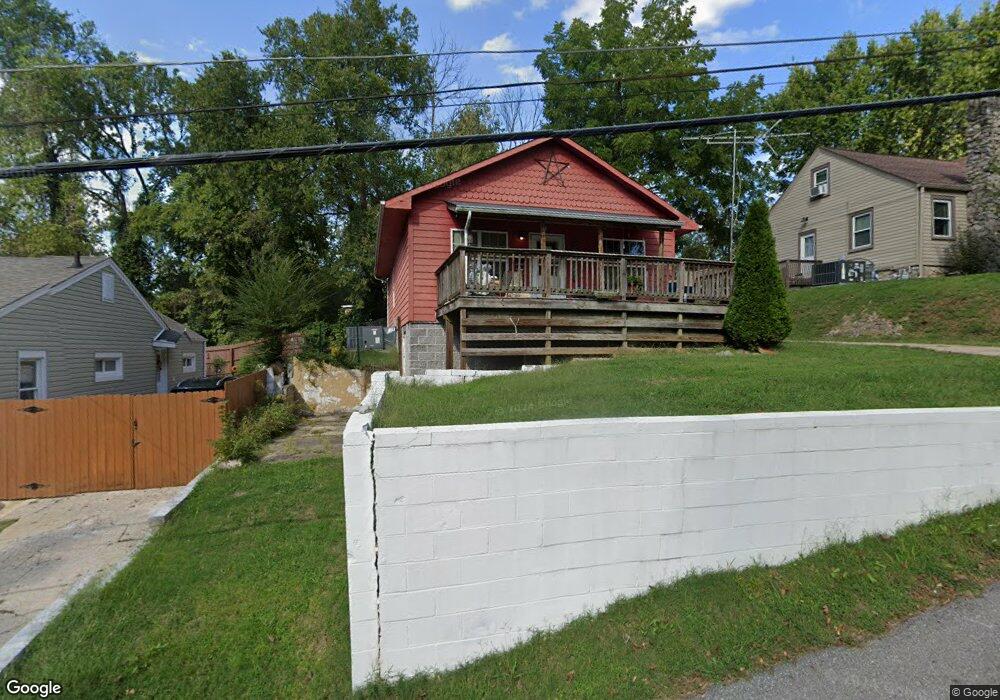
519 7th Ave W Springfield, TN 37172
Estimated Value: $170,183 - $218,000
Studio
2
Baths
850
Sq Ft
$223/Sq Ft
Est. Value
About This Home
This home is located at 519 7th Ave W, Springfield, TN 37172 and is currently estimated at $189,796, approximately $223 per square foot. 519 7th Ave W is a home located in Robertson County with nearby schools including Cheatham Park Elementary School, Westside Elementary School, and Innovation Academy.
Ownership History
Date
Name
Owned For
Owner Type
Purchase Details
Closed on
May 17, 2004
Sold by
Bradley John
Bought by
Adcox Elizabeth
Current Estimated Value
Purchase Details
Closed on
Oct 2, 1998
Bought by
Bradley John W
Home Financials for this Owner
Home Financials are based on the most recent Mortgage that was taken out on this home.
Original Mortgage
$38,500
Interest Rate
6.8%
Purchase Details
Closed on
Oct 24, 1997
Sold by
Draughon Reece E
Bought by
Kathleen Flat
Purchase Details
Closed on
Oct 9, 1997
Bought by
Flatt Kathleen
Purchase Details
Closed on
Aug 27, 1946
Bought by
Draughon Reece E
Create a Home Valuation Report for This Property
The Home Valuation Report is an in-depth analysis detailing your home's value as well as a comparison with similar homes in the area
Home Values in the Area
Average Home Value in this Area
Purchase History
| Date | Buyer | Sale Price | Title Company |
|---|---|---|---|
| Adcox Elizabeth | $54,000 | -- | |
| Bradley John W | $36,500 | -- | |
| Kathleen Flat | $35,550 | -- | |
| Flatt Kathleen | $35,600 | -- | |
| Draughon Reece E | -- | -- |
Source: Public Records
Mortgage History
| Date | Status | Borrower | Loan Amount |
|---|---|---|---|
| Previous Owner | Draughon Reece E | $38,500 |
Source: Public Records
Tax History
| Year | Tax Paid | Tax Assessment Tax Assessment Total Assessment is a certain percentage of the fair market value that is determined by local assessors to be the total taxable value of land and additions on the property. | Land | Improvement |
|---|---|---|---|---|
| 2025 | -- | $37,475 | $9,375 | $28,100 |
| 2024 | -- | $37,475 | $9,375 | $28,100 |
| 2023 | $939 | $37,475 | $9,375 | $28,100 |
| 2022 | $888 | $24,350 | $2,750 | $21,600 |
| 2021 | $888 | $24,350 | $2,750 | $21,600 |
| 2020 | $888 | $24,350 | $2,750 | $21,600 |
| 2019 | $26,727 | $24,350 | $2,750 | $21,600 |
| 2018 | $888 | $24,350 | $2,750 | $21,600 |
| 2017 | $857 | $20,000 | $2,125 | $17,875 |
| 2016 | $857 | $20,000 | $2,125 | $17,875 |
| 2015 | $832 | $20,000 | $2,125 | $17,875 |
| 2014 | $832 | $20,000 | $2,125 | $17,875 |
Source: Public Records
Map
Nearby Homes
Your Personal Tour Guide
Ask me questions while you tour the home.