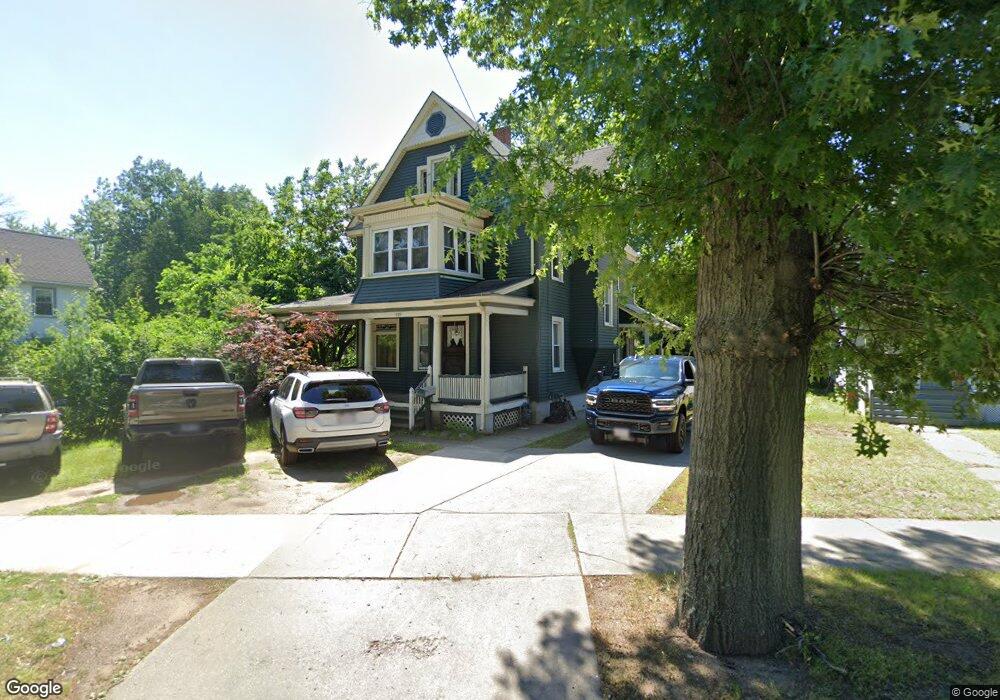
519 Berkshire Ave Springfield, MA 01109
Pine Point NeighborhoodEstimated Value: $300,000 - $359,000
6
Beds
2
Baths
2,259
Sq Ft
$142/Sq Ft
Est. Value
About This Home
This home is located at 519 Berkshire Ave, Springfield, MA 01109 and is currently estimated at $319,899, approximately $141 per square foot. 519 Berkshire Ave is a home located in Hampden County with nearby schools including Thomas M Balliet Elementary School, John F. Kennedy Academy, and Springfield Central High School.
Ownership History
Date
Name
Owned For
Owner Type
Purchase Details
Closed on
Dec 22, 2006
Sold by
Source 9 Dev Llc and Pafumi James A
Bought by
Navarro Jacqueline and Franqui Miguel A
Current Estimated Value
Home Financials for this Owner
Home Financials are based on the most recent Mortgage that was taken out on this home.
Original Mortgage
$180,000
Outstanding Balance
$107,857
Interest Rate
6.35%
Mortgage Type
Purchase Money Mortgage
Estimated Equity
$212,042
Purchase Details
Closed on
Apr 26, 2006
Sold by
Dearborn Ft and Dearborn Thomas P
Bought by
Source Nine Dev Llc
Purchase Details
Closed on
Nov 17, 2004
Sold by
Dearborn Thomas Paul
Bought by
Dearborn Ft and Dearborn Thomas P
Create a Home Valuation Report for This Property
The Home Valuation Report is an in-depth analysis detailing your home's value as well as a comparison with similar homes in the area
Home Values in the Area
Average Home Value in this Area
Purchase History
| Date | Buyer | Sale Price | Title Company |
|---|---|---|---|
| Navarro Jacqueline | $180,000 | -- | |
| Source Nine Dev Llc | $100,000 | -- | |
| Dearborn Ft | -- | -- |
Source: Public Records
Mortgage History
| Date | Status | Borrower | Loan Amount |
|---|---|---|---|
| Open | Navarro Jacqueline | $180,000 |
Source: Public Records
Tax History Compared to Growth
Tax History
| Year | Tax Paid | Tax Assessment Tax Assessment Total Assessment is a certain percentage of the fair market value that is determined by local assessors to be the total taxable value of land and additions on the property. | Land | Improvement |
|---|---|---|---|---|
| 2025 | $3,263 | $208,100 | $38,600 | $169,500 |
| 2024 | $3,321 | $206,800 | $38,600 | $168,200 |
| 2023 | $3,072 | $180,200 | $34,100 | $146,100 |
| 2022 | $2,960 | $157,300 | $31,900 | $125,400 |
| 2021 | $2,453 | $129,800 | $29,000 | $100,800 |
| 2020 | $2,568 | $131,500 | $29,000 | $102,500 |
| 2019 | $2,391 | $121,500 | $30,000 | $91,500 |
| 2018 | $2,395 | $121,700 | $30,000 | $91,700 |
| 2017 | $2,361 | $120,100 | $33,000 | $87,100 |
| 2016 | $2,247 | $114,300 | $33,000 | $81,300 |
| 2015 | $2,337 | $118,800 | $33,000 | $85,800 |
Source: Public Records
Map
Nearby Homes
- 515 Berkshire Ave
- 20 Rush St
- 11 Elizabeth St
- 28 Rush St
- 531 Berkshire Ave Unit 3-Bedroom Apartment
- 531 Berkshire Ave Unit 2
- 30 Rush St
- 19 Elizabeth St
- 5 County St
- 501 Berkshire Ave
- 36 Rush St
- 15 Rush St
- 11 Rush St
- 506 Berkshire Ave
- 25 Elizabeth St
- 25 Rush St
- 29-31 Rush St Unit 29
- 29-31 Rush St Unit 31
- 40 Rush St
- 495 Berkshire Ave