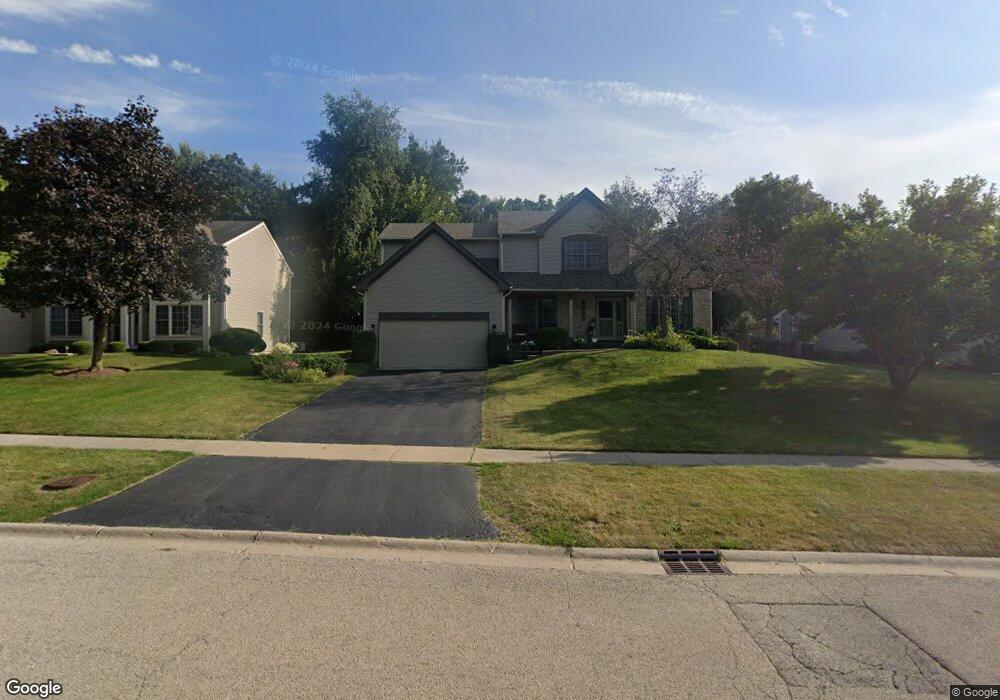
519 Carriage Hill Rd Island Lake, IL 60042
East Island Lake NeighborhoodEstimated Value: $376,000 - $396,000
4
Beds
3
Baths
2,082
Sq Ft
$186/Sq Ft
Est. Value
About This Home
This home is located at 519 Carriage Hill Rd, Island Lake, IL 60042 and is currently estimated at $387,023, approximately $185 per square foot. 519 Carriage Hill Rd is a home located in Lake County with nearby schools including Cotton Creek School, Matthews Middle School, and Wauconda High School.
Ownership History
Date
Name
Owned For
Owner Type
Purchase Details
Closed on
Feb 24, 2022
Sold by
Ramos Erman S
Bought by
Erman S Ramos Declaration Of Trust
Current Estimated Value
Purchase Details
Closed on
Nov 28, 2018
Sold by
Ramos Emelina S
Bought by
Ramos Erman S
Purchase Details
Closed on
Mar 26, 2010
Sold by
Harris Steven F and Harris Lona V
Bought by
Ramos Erman S and Ramos Emelina S
Home Financials for this Owner
Home Financials are based on the most recent Mortgage that was taken out on this home.
Original Mortgage
$160,000
Interest Rate
4.96%
Mortgage Type
New Conventional
Purchase Details
Closed on
Apr 23, 1996
Sold by
Einfalt Karl and Einfalt Carol
Bought by
Harris Steven F and Harris Lona A
Home Financials for this Owner
Home Financials are based on the most recent Mortgage that was taken out on this home.
Original Mortgage
$172,900
Interest Rate
7.86%
Create a Home Valuation Report for This Property
The Home Valuation Report is an in-depth analysis detailing your home's value as well as a comparison with similar homes in the area
Home Values in the Area
Average Home Value in this Area
Purchase History
| Date | Buyer | Sale Price | Title Company |
|---|---|---|---|
| Erman S Ramos Declaration Of Trust | -- | Lopez & Affiliates Ltd | |
| Ramos Erman S | -- | None Available | |
| Ramos Erman S | $212,000 | First American Title | |
| Harris Steven F | $182,000 | -- |
Source: Public Records
Mortgage History
| Date | Status | Borrower | Loan Amount |
|---|---|---|---|
| Previous Owner | Ramos Erman S | $160,000 | |
| Previous Owner | Harris Steven F | $172,900 |
Source: Public Records
Tax History Compared to Growth
Tax History
| Year | Tax Paid | Tax Assessment Tax Assessment Total Assessment is a certain percentage of the fair market value that is determined by local assessors to be the total taxable value of land and additions on the property. | Land | Improvement |
|---|---|---|---|---|
| 2024 | $7,615 | $103,580 | $21,168 | $82,412 |
| 2023 | $7,788 | $94,680 | $19,349 | $75,331 |
| 2022 | $7,788 | $86,385 | $20,953 | $65,432 |
| 2021 | $7,434 | $81,626 | $19,799 | $61,827 |
| 2020 | $7,134 | $77,411 | $18,871 | $58,540 |
| 2019 | $6,285 | $73,161 | $17,835 | $55,326 |
| 2018 | $6,843 | $72,603 | $21,149 | $51,454 |
| 2017 | $6,837 | $71,763 | $20,904 | $50,859 |
| 2016 | $6,497 | $67,957 | $19,795 | $48,162 |
| 2015 | $6,244 | $62,386 | $18,172 | $44,214 |
| 2014 | $6,090 | $57,906 | $16,988 | $40,918 |
| 2012 | $5,928 | $62,838 | $16,254 | $46,584 |
Source: Public Records
Map
Nearby Homes
- 3828 Eastway Dr
- 216 S Shore Dr Unit S
- 228 S Shore Dr
- 3819 Woodlawn Dr
- 236 Forest Dr
- 00 Burnett Rd
- lot 23 Park Dr
- 27692 N Oak St
- 706 E Burnett Rd
- NEC Route 176 & Westridge Dr
- 4342 Shooting Star Dr Unit 142
- 28094 E State Rd
- 318 David Ct
- 27569 N Beech St
- 4410 Shooting Star Ct
- 404 Lauren Ln
- 27405 N Roberts Ln
- 244 Red Oak Ct
- 811 Newport Dr
- 114 Maple St
- 609 Carriage Hill Rd
- 517 Carriage Hill Rd
- 515 Carriage Hill Rd Unit 3
- 611 Carriage Hill Rd
- 608 Carriage Hill Rd
- 520 Carriage Hill Rd
- 513 Carriage Hill Rd
- 518 Carriage Hill Rd
- 615 Carriage Hill Rd
- 610 Carriage Hill Rd
- 516 Carriage Hill Rd Unit 3
- 511 Carriage Hill Rd
- 3608 Burr Oak Ln Unit 3
- 3607 Burr Oak Ln
- 617 Carriage Hill Rd
- 514 Carriage Hill Rd
- 3112 Harvest Ct
- 3606 Burr Oak Ln
- 3107 Harvest Ct
- 509 Carriage Hill Rd