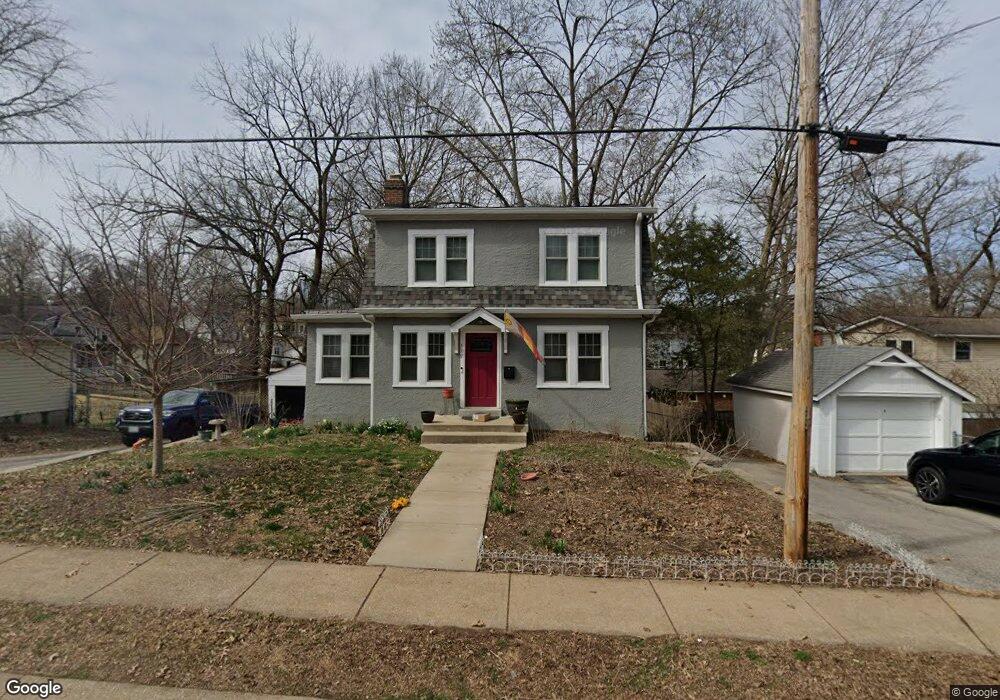
519 Cornelia Ave Saint Louis, MO 63119
Estimated Value: $428,000 - $451,000
3
Beds
2
Baths
1,598
Sq Ft
$276/Sq Ft
Est. Value
About This Home
This home is located at 519 Cornelia Ave, Saint Louis, MO 63119 and is currently estimated at $440,493, approximately $275 per square foot. 519 Cornelia Ave is a home located in St. Louis County with nearby schools including Avery Elementary School, Hixson Middle School, and Webster Groves High School.
Ownership History
Date
Name
Owned For
Owner Type
Purchase Details
Closed on
Jul 13, 2007
Sold by
Bolles Laurence H
Bought by
Dewald Jeffrey and Bentz Dewald Allison
Current Estimated Value
Home Financials for this Owner
Home Financials are based on the most recent Mortgage that was taken out on this home.
Original Mortgage
$187,900
Outstanding Balance
$117,138
Interest Rate
6.54%
Mortgage Type
Purchase Money Mortgage
Estimated Equity
$323,355
Purchase Details
Closed on
May 4, 2004
Sold by
Bolles Laurence H
Bought by
Bolles Laurence H and The Laurence H Bolles Revocable Trust
Home Financials for this Owner
Home Financials are based on the most recent Mortgage that was taken out on this home.
Original Mortgage
$111,400
Interest Rate
5.4%
Mortgage Type
Stand Alone Refi Refinance Of Original Loan
Purchase Details
Closed on
Aug 7, 1998
Sold by
Pogwizd Steven M and Pogwizd Cynthia T
Bought by
Bolles Laurence H and Bolles Barbara U
Home Financials for this Owner
Home Financials are based on the most recent Mortgage that was taken out on this home.
Original Mortgage
$120,000
Interest Rate
6.95%
Create a Home Valuation Report for This Property
The Home Valuation Report is an in-depth analysis detailing your home's value as well as a comparison with similar homes in the area
Home Values in the Area
Average Home Value in this Area
Purchase History
| Date | Buyer | Sale Price | Title Company |
|---|---|---|---|
| Dewald Jeffrey | $234,900 | None Available | |
| Bolles Laurence H | -- | -- | |
| Bolles Laurence H | -- | -- |
Source: Public Records
Mortgage History
| Date | Status | Borrower | Loan Amount |
|---|---|---|---|
| Open | Dewald Jeffrey | $187,900 | |
| Previous Owner | Bolles Laurence H | $111,400 | |
| Previous Owner | Bolles Laurence H | $120,000 |
Source: Public Records
Tax History
| Year | Tax Paid | Tax Assessment Tax Assessment Total Assessment is a certain percentage of the fair market value that is determined by local assessors to be the total taxable value of land and additions on the property. | Land | Improvement |
|---|---|---|---|---|
| 2025 | $4,963 | $80,050 | $44,630 | $35,420 |
| 2024 | $4,963 | $71,270 | $32,470 | $38,800 |
| 2023 | $4,939 | $71,270 | $32,470 | $38,800 |
| 2022 | $4,804 | $64,370 | $32,470 | $31,900 |
| 2021 | $4,787 | $64,370 | $32,470 | $31,900 |
| 2020 | $4,688 | $58,710 | $32,470 | $26,240 |
| 2019 | $4,654 | $58,710 | $32,470 | $26,240 |
| 2018 | $4,339 | $48,580 | $22,720 | $25,860 |
| 2017 | $4,310 | $48,580 | $22,720 | $25,860 |
| 2016 | $4,435 | $47,870 | $19,480 | $28,390 |
Source: Public Records
Map
Nearby Homes
- 638 Fairview Ave
- 532 Tuxedo Blvd
- 662 Fairview Ave
- 441 Park Rd
- 754 Greeley Ave
- 503 Atalanta Ave
- 332 Marion Ave
- 409 Summit Ave
- 732 Clark Ave
- 643 Marshall Ave
- 728 Marshall Ave
- 814 Clark Ave
- 234 Glen Rd
- 751 Atalanta Ave
- 727 Marshall Ave
- 643 Elmwood Ave
- 112 Oakwood Ave
- 400 Corona Ct
- 303 Corona Ct
- 108 N Old Orchard Ave
- 528 Fairview Ave
- 532 Fairview Ave
- 526 Fairview Ave
- 529 Newport Ave
- 520 Fairview Ave
- 537 Newport Ave
- 527 Newport Ave
- 521 Newport Ave
- 516 Fairview Ave
- 512 Fairview Uc Ave
- 512TBB Fairview Ave
- 512UC Fairview Ave
- 519 Newport Ave
- 518 Cornelia Ave
- 516 Cornelia Ave
- 512 Fairview Ave
- 524 Cornelia Ave
- 607 Newport Ave
- 515 Newport Ave
- 528 Cornelia Ave
Your Personal Tour Guide
Ask me questions while you tour the home.