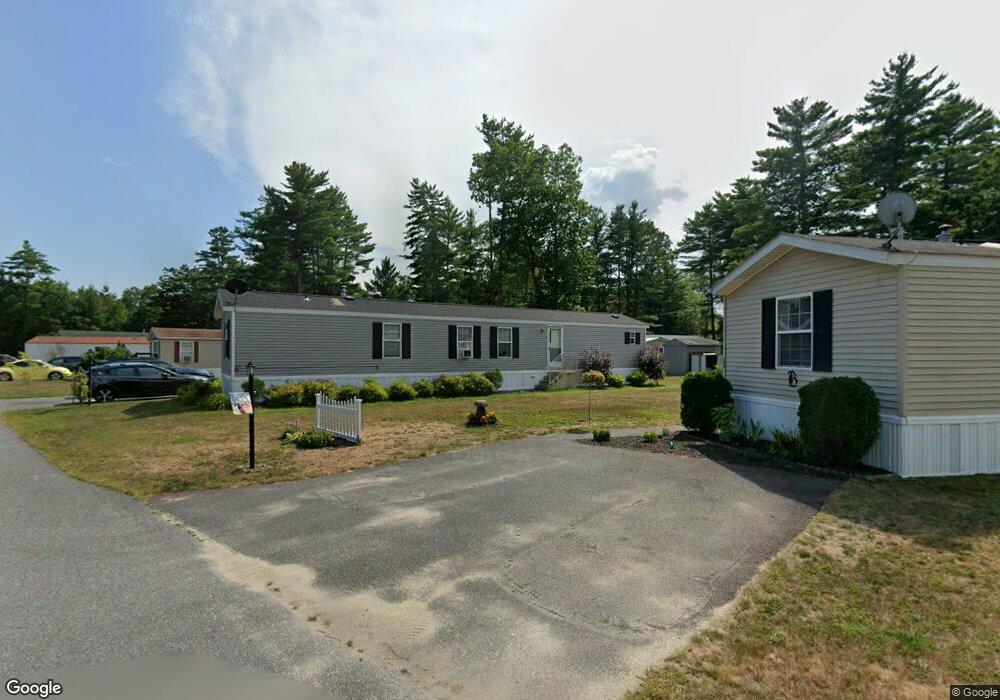
519 E River St Orange, MA 01364
Estimated Value: $3,027,000
3
Beds
2
Baths
980
Sq Ft
$3,089/Sq Ft
Est. Value
About This Home
This home is located at 519 E River St, Orange, MA 01364 and is currently priced at $3,027,000, approximately $3,088 per square foot. 519 E River St is a home located in Franklin County with nearby schools including Fisher Hill and Ralph C Mahar Regional School.
Ownership History
Date
Name
Owned For
Owner Type
Purchase Details
Closed on
Dec 1, 1997
Sold by
Leisure Woods Assoc
Bought by
Leisure Woods Est Inc
Current Estimated Value
Purchase Details
Closed on
Jun 24, 1992
Sold by
Rancourt Est Mobile Rt
Bought by
Leisure Woods Assoc
Create a Home Valuation Report for This Property
The Home Valuation Report is an in-depth analysis detailing your home's value as well as a comparison with similar homes in the area
Home Values in the Area
Average Home Value in this Area
Purchase History
| Date | Buyer | Sale Price | Title Company |
|---|---|---|---|
| Leisure Woods Est Inc | $1,535,000 | -- | |
| Leisure Woods Assoc | $568,900 | -- |
Source: Public Records
Mortgage History
| Date | Status | Borrower | Loan Amount |
|---|---|---|---|
| Open | Leisure Woods Assoc | $900,000 | |
| Closed | Leisure Woods Assoc | $800,000 |
Source: Public Records
Tax History
| Year | Tax Paid | Tax Assessment Tax Assessment Total Assessment is a certain percentage of the fair market value that is determined by local assessors to be the total taxable value of land and additions on the property. | Land | Improvement |
|---|---|---|---|---|
| 2025 | $56,537 | $3,436,900 | $271,200 | $3,165,700 |
| 2024 | $59,584 | $3,416,500 | $271,200 | $3,145,300 |
| 2023 | $60,920 | $3,392,000 | $271,200 | $3,120,800 |
| 2022 | $63,528 | $3,322,600 | $271,200 | $3,051,400 |
| 2021 | $61,812 | $3,082,900 | $278,600 | $2,804,300 |
| 2020 | $216 | $3,073,400 | $271,600 | $2,801,800 |
| 2019 | $214 | $3,033,800 | $240,000 | $2,793,800 |
| 2018 | $66,388 | $3,025,900 | $233,500 | $2,792,400 |
| 2017 | $64,444 | $3,035,500 | $233,500 | $2,802,000 |
| 2016 | $62,737 | $2,891,100 | $200,800 | $2,690,300 |
| 2015 | $60,902 | $2,932,200 | $200,800 | $2,731,400 |
| 2014 | -- | $2,952,300 | $200,800 | $2,751,500 |
Source: Public Records
Map
Nearby Homes
Your Personal Tour Guide
Ask me questions while you tour the home.