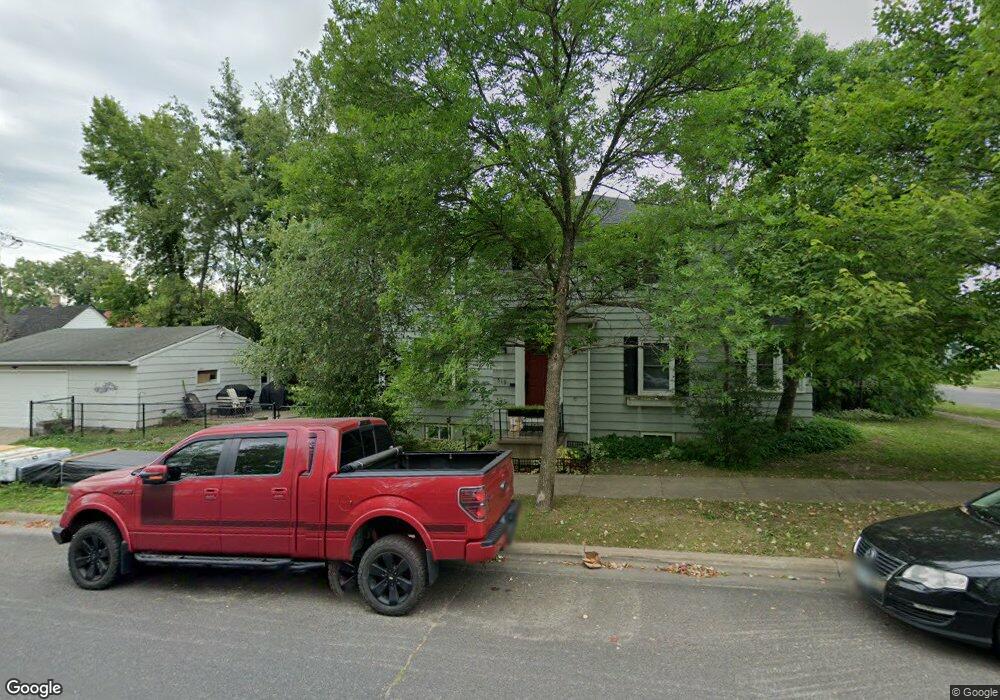
519 Mckinley Ave Eveleth, MN 55734
Estimated Value: $150,621 - $164,000
4
Beds
2
Baths
1,949
Sq Ft
$80/Sq Ft
Est. Value
About This Home
This home is located at 519 Mckinley Ave, Eveleth, MN 55734 and is currently estimated at $155,905, approximately $79 per square foot. 519 Mckinley Ave is a home located in St. Louis County with nearby schools including Nelle Shean Elementary School, Franklin Elementary School, and Eveleth-Gilbert Junior High School.
Ownership History
Date
Name
Owned For
Owner Type
Purchase Details
Closed on
Nov 4, 2010
Sold by
Sabetti John M and Sabetti Connie Jean
Bought by
Anderson Collin J and Vaughan Rachel A
Current Estimated Value
Home Financials for this Owner
Home Financials are based on the most recent Mortgage that was taken out on this home.
Original Mortgage
$86,830
Outstanding Balance
$57,231
Interest Rate
4.25%
Mortgage Type
FHA
Estimated Equity
$98,674
Purchase Details
Closed on
Sep 12, 2008
Sold by
Hoel Stacia Sullivan and Hoel Jonathan Girard
Bought by
Sabetti John M and Sabetti Constance J
Purchase Details
Closed on
Nov 7, 2003
Sold by
Sabetti John M and Sabetti Constance J
Bought by
Sabetti Stacia Sullivan
Create a Home Valuation Report for This Property
The Home Valuation Report is an in-depth analysis detailing your home's value as well as a comparison with similar homes in the area
Home Values in the Area
Average Home Value in this Area
Purchase History
| Date | Buyer | Sale Price | Title Company |
|---|---|---|---|
| Anderson Collin J | $88,000 | Canoe Country Title | |
| Sabetti John M | -- | None Available | |
| Sabetti Stacia Sullivan | -- | -- |
Source: Public Records
Mortgage History
| Date | Status | Borrower | Loan Amount |
|---|---|---|---|
| Open | Anderson Collin J | $86,830 |
Source: Public Records
Tax History Compared to Growth
Tax History
| Year | Tax Paid | Tax Assessment Tax Assessment Total Assessment is a certain percentage of the fair market value that is determined by local assessors to be the total taxable value of land and additions on the property. | Land | Improvement |
|---|---|---|---|---|
| 2023 | $1,622 | $115,500 | $4,100 | $111,400 |
| 2022 | $1,122 | $86,200 | $3,700 | $82,500 |
| 2021 | $1,020 | $91,400 | $3,400 | $88,000 |
| 2020 | $992 | $91,400 | $3,400 | $88,000 |
| 2019 | $850 | $91,400 | $3,400 | $88,000 |
| 2018 | $604 | $91,400 | $3,400 | $88,000 |
| 2017 | $492 | $81,100 | $3,400 | $77,700 |
| 2016 | $444 | $72,800 | $3,400 | $69,400 |
| 2015 | $410 | $43,700 | $2,100 | $41,600 |
| 2014 | $410 | $43,700 | $2,100 | $41,600 |
Source: Public Records
Map
Nearby Homes