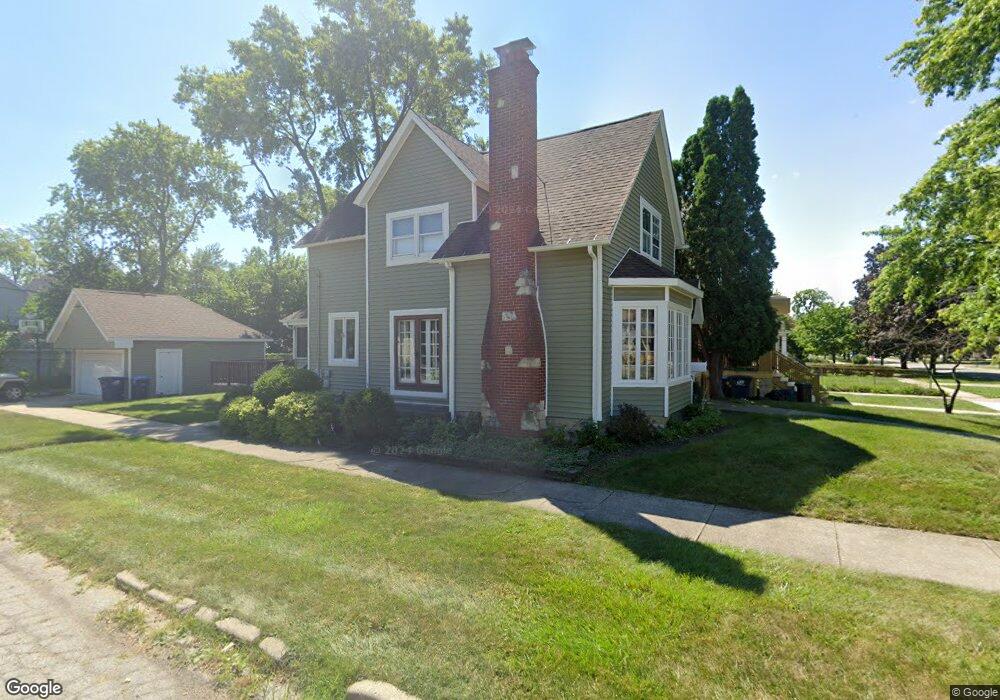
519 N 3rd Ave Maywood, IL 60153
North Maywood NeighborhoodEstimated Value: $276,064 - $355,000
3
Beds
1
Bath
1,520
Sq Ft
$210/Sq Ft
Est. Value
About This Home
This home is located at 519 N 3rd Ave, Maywood, IL 60153 and is currently estimated at $318,766, approximately $209 per square foot. 519 N 3rd Ave is a home located in Cook County with nearby schools including Lincoln Elementary School, Stevenson Middle School, and Proviso East High School.
Ownership History
Date
Name
Owned For
Owner Type
Purchase Details
Closed on
Jul 21, 2020
Sold by
Smith Kara Quinn and Holder Kara E
Bought by
Holder Kara E and The Kara E Holder Revocable Li
Current Estimated Value
Purchase Details
Closed on
Sep 14, 2002
Sold by
Fifth Third Bank
Bought by
Towery Julia A
Home Financials for this Owner
Home Financials are based on the most recent Mortgage that was taken out on this home.
Original Mortgage
$168,500
Interest Rate
5.5%
Purchase Details
Closed on
Sep 21, 2000
Sold by
Towery Julia L
Bought by
Old Kent Bank and Trust #13101
Create a Home Valuation Report for This Property
The Home Valuation Report is an in-depth analysis detailing your home's value as well as a comparison with similar homes in the area
Home Values in the Area
Average Home Value in this Area
Purchase History
| Date | Buyer | Sale Price | Title Company |
|---|---|---|---|
| Holder Kara E | -- | Attorneys Ttl Guaranty Fund | |
| Towery Julia A | -- | -- | |
| Old Kent Bank | -- | -- |
Source: Public Records
Mortgage History
| Date | Status | Borrower | Loan Amount |
|---|---|---|---|
| Previous Owner | Towery Julia A | $168,500 |
Source: Public Records
Tax History Compared to Growth
Tax History
| Year | Tax Paid | Tax Assessment Tax Assessment Total Assessment is a certain percentage of the fair market value that is determined by local assessors to be the total taxable value of land and additions on the property. | Land | Improvement |
|---|---|---|---|---|
| 2024 | $8,481 | $23,000 | $2,727 | $20,273 |
| 2023 | $7,096 | $23,000 | $2,727 | $20,273 |
| 2022 | $7,096 | $16,025 | $2,355 | $13,670 |
| 2021 | $7,176 | $16,024 | $2,355 | $13,669 |
| 2020 | $7,122 | $16,024 | $2,355 | $13,669 |
| 2019 | $6,902 | $14,353 | $2,107 | $12,246 |
| 2018 | $6,711 | $14,353 | $2,107 | $12,246 |
| 2017 | $6,521 | $14,353 | $2,107 | $12,246 |
| 2016 | $6,128 | $12,364 | $1,859 | $10,505 |
| 2015 | $5,639 | $12,364 | $1,859 | $10,505 |
| 2014 | $5,186 | $12,364 | $1,859 | $10,505 |
| 2013 | $5,873 | $14,772 | $1,859 | $12,913 |
Source: Public Records
Map
Nearby Homes