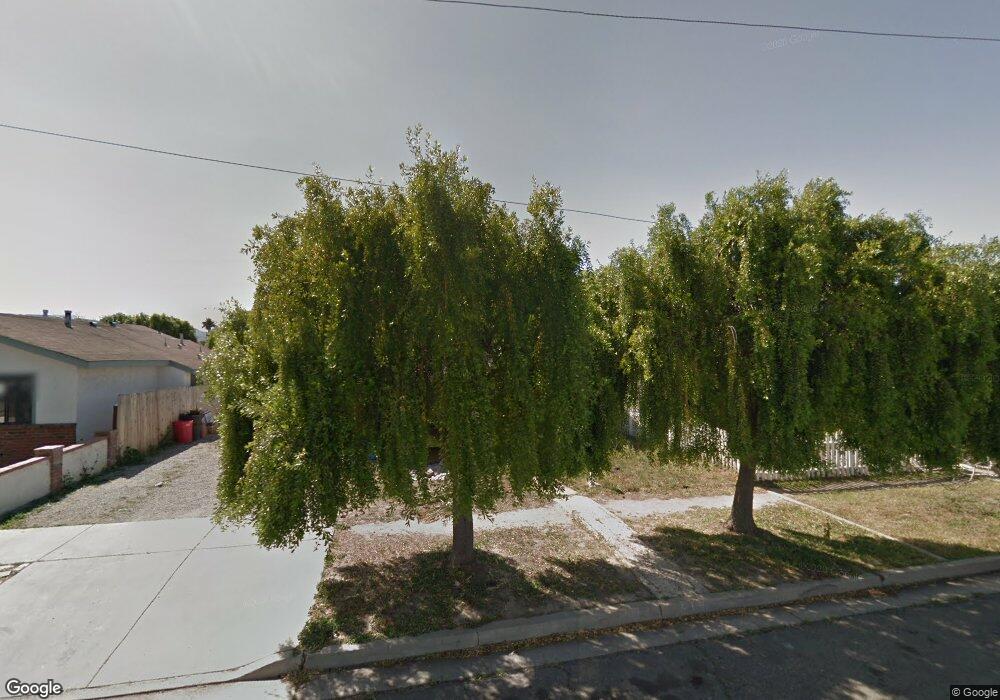
519 N F St Lompoc, CA 93436
Estimated Value: $388,529 - $474,000
2
Beds
1
Bath
653
Sq Ft
$650/Sq Ft
Est. Value
About This Home
This home is located at 519 N F St, Lompoc, CA 93436 and is currently estimated at $424,132, approximately $649 per square foot. 519 N F St is a home located in Santa Barbara County with nearby schools including La Honda STEAM Academy, Cabrillo High School, and Olive Grove Charter - Lompoc.
Ownership History
Date
Name
Owned For
Owner Type
Purchase Details
Closed on
Jul 26, 2018
Sold by
Perez Araceli
Bought by
Perez Araceli and Ramirez Abraham
Current Estimated Value
Purchase Details
Closed on
Aug 11, 2017
Sold by
Morales Raul
Bought by
Perez Araceli
Home Financials for this Owner
Home Financials are based on the most recent Mortgage that was taken out on this home.
Original Mortgage
$230,743
Outstanding Balance
$190,744
Interest Rate
3.62%
Mortgage Type
FHA
Estimated Equity
$233,388
Purchase Details
Closed on
Oct 10, 2013
Sold by
Morales Mary Terrones
Bought by
Morales Mary Terrones and The Jose Avila Morales & Mary Terrones M
Purchase Details
Closed on
Dec 28, 2012
Sold by
Morales Jose Avila and Morales Mary Terrones
Bought by
Morales Jose Avila and Morales Mary Terrones
Create a Home Valuation Report for This Property
The Home Valuation Report is an in-depth analysis detailing your home's value as well as a comparison with similar homes in the area
Home Values in the Area
Average Home Value in this Area
Purchase History
| Date | Buyer | Sale Price | Title Company |
|---|---|---|---|
| Perez Araceli | -- | First American Title Co | |
| Perez Araceli | $235,000 | First American Title Company | |
| Morales Mary Terrones | -- | None Available | |
| Morales Jose Avila | -- | None Available | |
| Morales Jose Avila | -- | None Available |
Source: Public Records
Mortgage History
| Date | Status | Borrower | Loan Amount |
|---|---|---|---|
| Open | Perez Araceli | $230,743 |
Source: Public Records
Tax History
| Year | Tax Paid | Tax Assessment Tax Assessment Total Assessment is a certain percentage of the fair market value that is determined by local assessors to be the total taxable value of land and additions on the property. | Land | Improvement |
|---|---|---|---|---|
| 2025 | $2,857 | $267,384 | $102,402 | $164,982 |
| 2023 | $2,857 | $257,004 | $98,427 | $158,577 |
| 2022 | $2,804 | $251,966 | $96,498 | $155,468 |
| 2021 | $2,833 | $247,026 | $94,606 | $152,420 |
| 2020 | $2,802 | $244,494 | $93,636 | $150,858 |
| 2019 | $2,754 | $239,700 | $91,800 | $147,900 |
| 2018 | $2,710 | $235,000 | $90,000 | $145,000 |
| 2017 | $1,108 | $91,008 | $63,716 | $27,292 |
| 2016 | $1,088 | $89,224 | $62,467 | $26,757 |
| 2014 | $1,065 | $86,164 | $60,324 | $25,840 |
Source: Public Records
Map
Nearby Homes
- 533 N G St
- 510 N I St
- 610 E Pine Ave Unit 10
- 610 E Pine Ave Unit 29
- 610 E Pine Ave Unit 62
- 526 N L St
- 622 N B St
- 505 N 1st St
- 801, 851 California 246
- 701 E Pine Ave Unit 182
- 701 E Pine Ave Unit 176
- 701 E Pine Ave Unit 171
- 701 E Pine Ave Unit 161
- 117 S I St
- 217 N M St
- 531 N O St
- 205 S E St
- 321 N Third St
- 240 Quail Cir
- 215 S H St
Your Personal Tour Guide
Ask me questions while you tour the home.