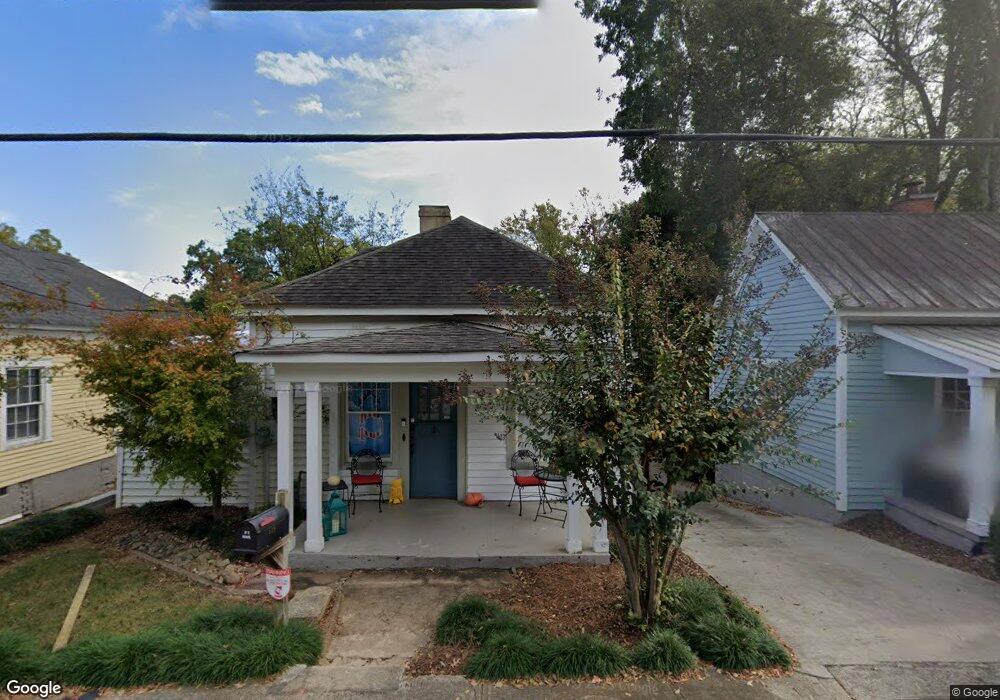
519 Reese St Athens, GA 30601
Estimated Value: $339,291 - $563,000
4
Beds
2
Baths
1,387
Sq Ft
$329/Sq Ft
Est. Value
About This Home
This home is located at 519 Reese St, Athens, GA 30601 and is currently estimated at $456,573, approximately $329 per square foot. 519 Reese St is a home located in Clarke County with nearby schools including Johnnie Lay Burks Elementary School, Clarke Middle School, and Clarke Central High School.
Ownership History
Date
Name
Owned For
Owner Type
Purchase Details
Closed on
Jan 24, 2013
Sold by
Hathaway Richard M
Bought by
Austin & Austin Holdings Llc
Current Estimated Value
Purchase Details
Closed on
Mar 18, 1996
Sold by
Hathaway Richard M and Paul Stanzi
Bought by
Hathaway Richard M
Purchase Details
Closed on
Apr 12, 1995
Sold by
Strickland Sallie S
Bought by
Hathaway Richard M and Paul Stanzi
Purchase Details
Closed on
Mar 23, 1989
Sold by
Brantley Addie
Bought by
Strickland Sallie S
Create a Home Valuation Report for This Property
The Home Valuation Report is an in-depth analysis detailing your home's value as well as a comparison with similar homes in the area
Home Values in the Area
Average Home Value in this Area
Purchase History
| Date | Buyer | Sale Price | Title Company |
|---|---|---|---|
| Austin & Austin Holdings Llc | $975,000 | -- | |
| Hathaway Richard M | $9,000 | -- | |
| Hathaway Richard M | $12,000 | -- | |
| Strickland Sallie S | -- | -- |
Source: Public Records
Tax History Compared to Growth
Tax History
| Year | Tax Paid | Tax Assessment Tax Assessment Total Assessment is a certain percentage of the fair market value that is determined by local assessors to be the total taxable value of land and additions on the property. | Land | Improvement |
|---|---|---|---|---|
| 2025 | $3,171 | $102,137 | $28,800 | $73,337 |
| 2024 | $3,171 | $91,654 | $25,200 | $66,454 |
| 2023 | $2,864 | $81,269 | $25,200 | $56,069 |
| 2022 | $2,340 | $73,340 | $25,200 | $48,140 |
| 2021 | $1,992 | $59,111 | $22,500 | $36,611 |
| 2020 | $1,888 | $56,020 | $22,500 | $33,520 |
| 2019 | $1,858 | $54,718 | $22,500 | $32,218 |
| 2018 | $1,858 | $54,718 | $22,500 | $32,218 |
| 2017 | $1,827 | $53,818 | $21,600 | $32,218 |
| 2016 | $1,781 | $52,444 | $21,600 | $30,844 |
| 2015 | $1,661 | $48,844 | $18,000 | $30,844 |
| 2014 | $1,292 | $37,953 | $18,000 | $19,953 |
Source: Public Records
Map
Nearby Homes
- 257 Hill St
- 500 Dearing St Unit 6
- 468 N Milledge Ave Unit 203
- 365 S Church St Unit 1A, 1B, 1C
- 597 Dearing St
- 570 Prince Ave
- 1196 W Hancock Ave Unit 1
- 1198 W West Hancock Ave W
- 1226 W Broad St
- 480 N Billups St
- 250 W Broad St Unit 811
- 250 W Broad St Unit 521
- 250 W Broad St Unit 408
- 250 W Broad St Unit 615
- 100 Prince Ave Unit A404
- 100 Prince Ave Unit A407
- 494 Baxter St Unit 32
- 269 N Hull St Unit 212
- 552 Cobb St
- 559 Pulaski St