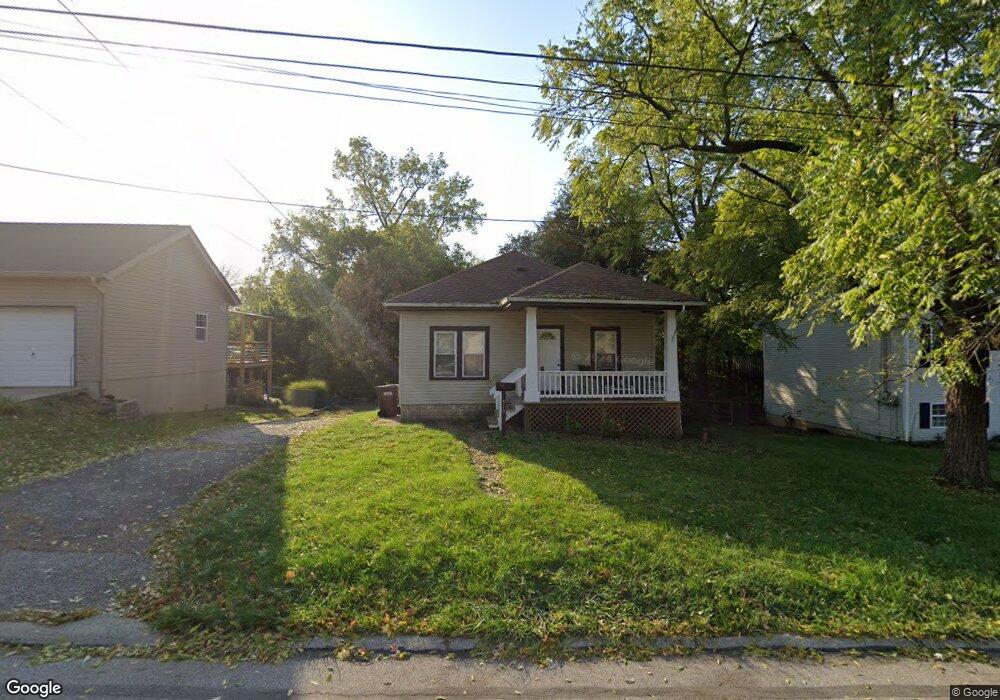
519 Spring St Elsmere, KY 41018
Estimated Value: $124,000 - $179,000
2
Beds
1
Bath
783
Sq Ft
$185/Sq Ft
Est. Value
About This Home
This home is located at 519 Spring St, Elsmere, KY 41018 and is currently estimated at $144,580, approximately $184 per square foot. 519 Spring St is a home located in Kenton County with nearby schools including Howell Elementary School, Tichenor Middle School, and Lloyd Memorial High School.
Ownership History
Date
Name
Owned For
Owner Type
Purchase Details
Closed on
Jun 24, 2013
Sold by
Secretary Of Housing & Urban Development
Bought by
Schneider Gretchen
Current Estimated Value
Purchase Details
Closed on
Feb 4, 2013
Sold by
Jones Philip W
Bought by
Secretary Of Housing & Urban Development
Purchase Details
Closed on
Jan 12, 2004
Sold by
Steele John O and Steele Jacqueline M
Bought by
Jones Philip W
Home Financials for this Owner
Home Financials are based on the most recent Mortgage that was taken out on this home.
Original Mortgage
$64,452
Interest Rate
6.03%
Mortgage Type
FHA
Purchase Details
Closed on
Nov 25, 1996
Sold by
Barth Craig
Bought by
Steele John O
Home Financials for this Owner
Home Financials are based on the most recent Mortgage that was taken out on this home.
Original Mortgage
$38,500
Interest Rate
7.83%
Mortgage Type
New Conventional
Create a Home Valuation Report for This Property
The Home Valuation Report is an in-depth analysis detailing your home's value as well as a comparison with similar homes in the area
Home Values in the Area
Average Home Value in this Area
Purchase History
| Date | Buyer | Sale Price | Title Company |
|---|---|---|---|
| Schneider Gretchen | $30,047 | Regional First Title Group L | |
| Secretary Of Housing & Urban Development | $50,100 | None Available | |
| Jones Philip W | $65,000 | Northern Kentucky Title | |
| Steele John O | $55,000 | -- |
Source: Public Records
Mortgage History
| Date | Status | Borrower | Loan Amount |
|---|---|---|---|
| Previous Owner | Jones Philip W | $64,452 | |
| Previous Owner | Steele John O | $38,500 |
Source: Public Records
Tax History
| Year | Tax Paid | Tax Assessment Tax Assessment Total Assessment is a certain percentage of the fair market value that is determined by local assessors to be the total taxable value of land and additions on the property. | Land | Improvement |
|---|---|---|---|---|
| 2025 | $989 | $114,200 | $20,000 | $94,200 |
| 2024 | $1,042 | $114,200 | $20,000 | $94,200 |
| 2023 | $1,016 | $114,200 | $20,000 | $94,200 |
| 2022 | $486 | $66,000 | $10,000 | $56,000 |
| 2021 | $492 | $66,000 | $10,000 | $56,000 |
| 2020 | $509 | $66,000 | $10,000 | $56,000 |
| 2019 | $503 | $66,000 | $10,000 | $56,000 |
| 2018 | $441 | $60,000 | $10,000 | $50,000 |
| 2017 | $358 | $60,000 | $10,000 | $50,000 |
| 2015 | $565 | $30,000 | $10,000 | $20,000 |
| 2014 | $553 | $30,000 | $10,000 | $20,000 |
Source: Public Records
Map
Nearby Homes
- 510 Fox St
- 420 Buckner St
- 712 Bedinger St
- 424 Caldwell Dr
- 847 Virginiabradford Ct
- 841 Virginiabradford Ct
- 454 Swan Cir
- 4117-4127 Dixie Hwy
- 4120 Dixie Hwy
- 505 Stevenson Rd
- 3658 Mitten Dr
- 110 Lee St
- 9 Park Ave
- 554 Ripple Creek Dr
- 129 Barren River Dr Unit 9
- 11 May St
- 417 Timberlake Ave
- 130 Buckhorn Ct Unit 8
- 1149 Fallbrook Dr
- 107 Mcalpin Ave
Your Personal Tour Guide
Ask me questions while you tour the home.