519 Timpson Ave Unit 87 Durham, NC 27703
Eastern Durham NeighborhoodEstimated Value: $339,000 - $359,000
3
Beds
3
Baths
1,600
Sq Ft
$218/Sq Ft
Est. Value
About This Home
This home is located at 519 Timpson Ave Unit 87, Durham, NC 27703 and is currently estimated at $349,580, approximately $218 per square foot. 519 Timpson Ave Unit 87 is a home located in Durham County with nearby schools including Spring Valley Elementary School, John W Neal Middle School, and Southern School of Energy & Sustainability.
Ownership History
Date
Name
Owned For
Owner Type
Purchase Details
Closed on
Aug 26, 2020
Sold by
Tran Kenny V and Lim Si On
Bought by
Branch Cedric Lavelle and Branch Ryann
Current Estimated Value
Home Financials for this Owner
Home Financials are based on the most recent Mortgage that was taken out on this home.
Original Mortgage
$237,650
Outstanding Balance
$210,899
Interest Rate
2.9%
Mortgage Type
New Conventional
Estimated Equity
$138,681
Purchase Details
Closed on
Jun 4, 2016
Sold by
Dan Ryan Builders North Ca
Bought by
Tran V Kenny
Home Financials for this Owner
Home Financials are based on the most recent Mortgage that was taken out on this home.
Original Mortgage
$157,500
Interest Rate
3.61%
Mortgage Type
New Conventional
Purchase Details
Closed on
Feb 5, 2016
Sold by
Mrec Brightleaf Llc
Bought by
Dan Ryan Builders North Caroli
Create a Home Valuation Report for This Property
The Home Valuation Report is an in-depth analysis detailing your home's value as well as a comparison with similar homes in the area
Home Values in the Area
Average Home Value in this Area
Purchase History
| Date | Buyer | Sale Price | Title Company |
|---|---|---|---|
| Branch Cedric Lavelle | $245,000 | None Available | |
| Tran V Kenny | $197,000 | -- | |
| Dan Ryan Builders North Caroli | $175,000 | -- |
Source: Public Records
Mortgage History
| Date | Status | Borrower | Loan Amount |
|---|---|---|---|
| Open | Branch Cedric Lavelle | $237,650 | |
| Previous Owner | Tran V Kenny | $157,500 |
Source: Public Records
Tax History Compared to Growth
Tax History
| Year | Tax Paid | Tax Assessment Tax Assessment Total Assessment is a certain percentage of the fair market value that is determined by local assessors to be the total taxable value of land and additions on the property. | Land | Improvement |
|---|---|---|---|---|
| 2025 | $2,910 | $353,026 | $75,000 | $278,026 |
| 2024 | $2,910 | $208,589 | $40,000 | $168,589 |
| 2023 | $2,732 | $208,589 | $40,000 | $168,589 |
| 2022 | $2,670 | $208,589 | $40,000 | $168,589 |
| 2021 | $2,657 | $208,589 | $40,000 | $168,589 |
| 2020 | $2,595 | $208,589 | $40,000 | $168,589 |
| 2019 | $2,595 | $208,589 | $40,000 | $168,589 |
| 2018 | $2,184 | $161,004 | $30,000 | $131,004 |
| 2017 | $2,168 | $161,004 | $30,000 | $131,004 |
| 2016 | $390 | $30,000 | $30,000 | $0 |
Source: Public Records
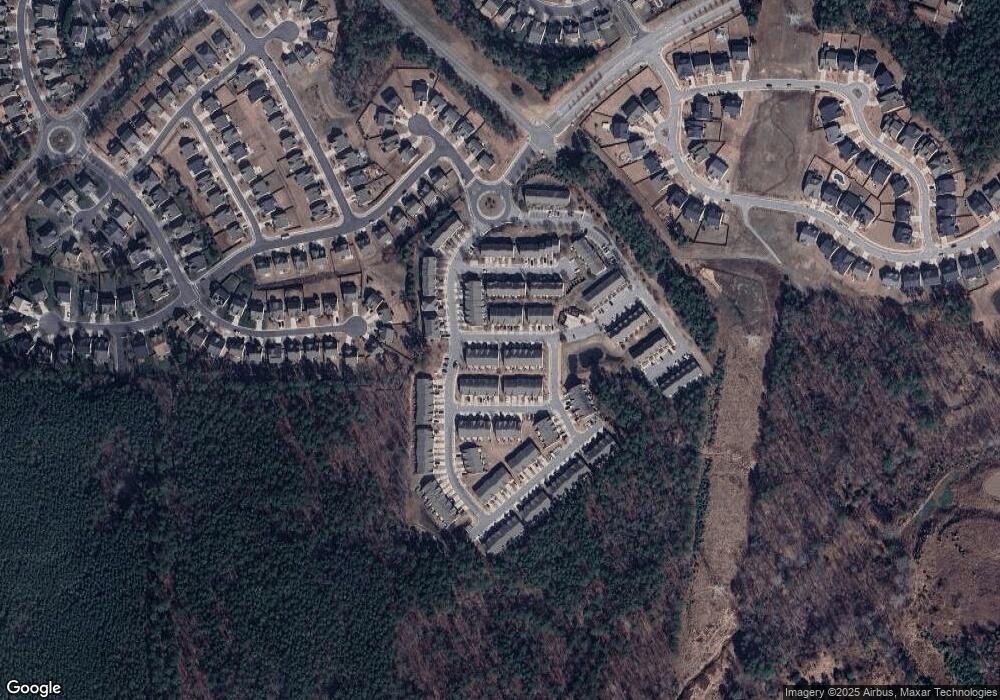
Map
Nearby Homes
- 205 Spring Flower Ln
- 2018 Morehead Hill Ct
- 14 Prairie View Ct
- 204 Irving Way
- 408 Timpson Ave
- 1006 Red Rock Dr
- 1605 Morehead Hill Ct
- 2815 Mebane Ln
- 1712 Morehead Hill Ct
- 3007 Prospect Pkwy
- 1602 Eagle Lodge Ln
- 4 Seawell Ct
- 3338 Prospect Pkwy
- 1017 Constellation Cir
- 1106 Constellation Cir
- 1102 Constellation Cir
- Coleman Plan at Stella View - Ardmore Collection
- Tryon III Plan at Stella View - Summit Collection
- Mayflower III Plan at Stella View - Summit Collection
- Landrum III Plan at Stella View - Summit Collection
- 519 Timpson Ave
- 515 Timpson Ave Unit 88
- 521 Timpson Ave
- 523 Timpson Ave Unit 85
- 523 Timpson Ave
- 513 Timpson Ave
- 513 Timpson Ave Unit 89
- 525 Timpson Ave Unit 84
- 511 Timpson Ave Unit 90
- 511 Timpson Ave Unit 91
- 527 Timpson Ave Unit 83
- 527 Timpson Ave
- 509 Timpson Ave
- 116 Phantom Ln Unit 266
- 116 Phantom Ln
- 118 Phantom Ln Unit 267
- 112 Phantom Ln Unit 265
- 112 Phantom Ln
- 120 Phantom Ln
- 520 Timpson Ave