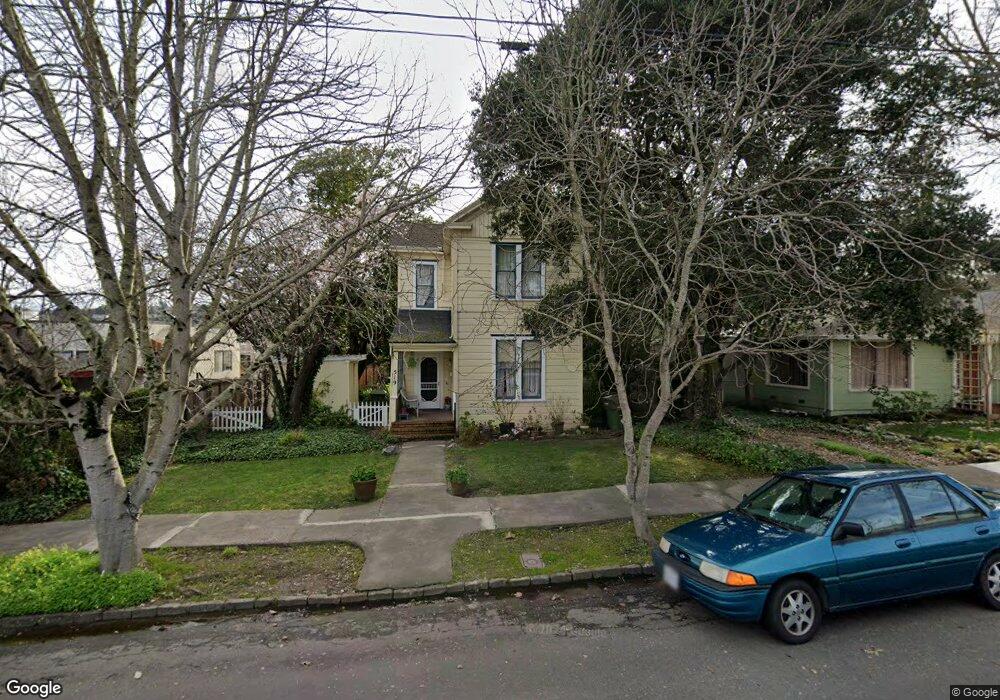
519 Upham St Petaluma, CA 94952
Western Petaluma NeighborhoodEstimated Value: $1,018,000 - $1,241,000
4
Beds
2
Baths
1,730
Sq Ft
$649/Sq Ft
Est. Value
About This Home
This home is located at 519 Upham St, Petaluma, CA 94952 and is currently estimated at $1,122,667, approximately $648 per square foot. 519 Upham St is a home located in Sonoma County with nearby schools including Valley Vista Elementary School, Petaluma Junior High School, and Petaluma High School.
Ownership History
Date
Name
Owned For
Owner Type
Purchase Details
Closed on
Mar 27, 2025
Sold by
Fannin William Jones and Fannin Linda Storey
Bought by
William Jones Fannin and William Linda Storey
Current Estimated Value
Purchase Details
Closed on
Aug 22, 2023
Sold by
Fannin William J and Fannin Linda
Bought by
Fannin William J and Fannin Linda
Home Financials for this Owner
Home Financials are based on the most recent Mortgage that was taken out on this home.
Original Mortgage
$100,000
Interest Rate
6.78%
Mortgage Type
Credit Line Revolving
Create a Home Valuation Report for This Property
The Home Valuation Report is an in-depth analysis detailing your home's value as well as a comparison with similar homes in the area
Home Values in the Area
Average Home Value in this Area
Purchase History
| Date | Buyer | Sale Price | Title Company |
|---|---|---|---|
| William Jones Fannin | -- | None Listed On Document | |
| Fannin William J | -- | Fidelity National Title |
Source: Public Records
Mortgage History
| Date | Status | Borrower | Loan Amount |
|---|---|---|---|
| Previous Owner | Fannin William J | $100,000 |
Source: Public Records
Tax History
| Year | Tax Paid | Tax Assessment Tax Assessment Total Assessment is a certain percentage of the fair market value that is determined by local assessors to be the total taxable value of land and additions on the property. | Land | Improvement |
|---|---|---|---|---|
| 2025 | $2,132 | $187,494 | $72,035 | $115,459 |
| 2024 | $2,132 | $183,819 | $70,623 | $113,196 |
| 2023 | $2,132 | $180,216 | $69,239 | $110,977 |
| 2022 | $2,001 | $176,683 | $67,882 | $108,801 |
| 2021 | $1,964 | $173,219 | $66,551 | $106,668 |
| 2020 | $1,979 | $171,444 | $65,869 | $105,575 |
| 2019 | $1,955 | $168,083 | $64,578 | $103,505 |
| 2018 | $1,946 | $164,788 | $63,312 | $101,476 |
| 2017 | $1,906 | $161,558 | $62,071 | $99,487 |
| 2016 | $1,854 | $158,391 | $60,854 | $97,537 |
| 2015 | $1,828 | $156,012 | $59,940 | $96,072 |
| 2014 | $1,818 | $152,957 | $58,766 | $94,191 |
Source: Public Records
Map
Nearby Homes
Your Personal Tour Guide
Ask me questions while you tour the home.