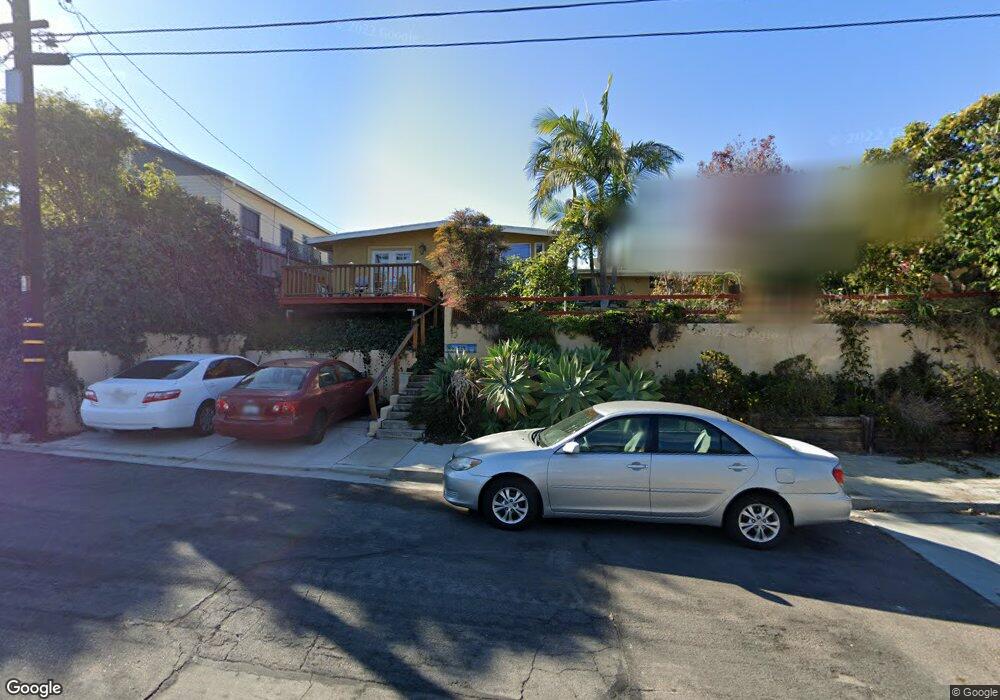
519 Vine St Oceanside, CA 92054
Downtown Oceanside NeighborhoodEstimated Value: $1,015,297 - $1,314,000
3
Beds
2
Baths
1,569
Sq Ft
$751/Sq Ft
Est. Value
About This Home
This home is located at 519 Vine St, Oceanside, CA 92054 and is currently estimated at $1,177,574, approximately $750 per square foot. 519 Vine St is a home located in San Diego County with nearby schools including Laurel Elementary School, Lincoln Middle School, and Oceanside High School.
Ownership History
Date
Name
Owned For
Owner Type
Purchase Details
Closed on
Sep 11, 2012
Sold by
Barton Thomas W and Barton Jerrie M
Bought by
Barton Thomas W and Barton Jerrie M
Current Estimated Value
Purchase Details
Closed on
Apr 4, 1996
Sold by
Jackson Judy Lee and Schultz Roy E
Bought by
Barton Tom W and Barton Jerrie M
Home Financials for this Owner
Home Financials are based on the most recent Mortgage that was taken out on this home.
Original Mortgage
$97,699
Outstanding Balance
$4,815
Interest Rate
7.84%
Mortgage Type
FHA
Estimated Equity
$1,172,759
Create a Home Valuation Report for This Property
The Home Valuation Report is an in-depth analysis detailing your home's value as well as a comparison with similar homes in the area
Home Values in the Area
Average Home Value in this Area
Purchase History
| Date | Buyer | Sale Price | Title Company |
|---|---|---|---|
| Barton Thomas W | -- | None Available | |
| Barton Tom W | $98,000 | Chicago Title Co |
Source: Public Records
Mortgage History
| Date | Status | Borrower | Loan Amount |
|---|---|---|---|
| Open | Barton Tom W | $97,699 |
Source: Public Records
Tax History
| Year | Tax Paid | Tax Assessment Tax Assessment Total Assessment is a certain percentage of the fair market value that is determined by local assessors to be the total taxable value of land and additions on the property. | Land | Improvement |
|---|---|---|---|---|
| 2025 | $2,268 | $209,369 | $59,285 | $150,084 |
| 2024 | $2,268 | $205,265 | $58,123 | $147,142 |
| 2023 | $2,197 | $201,241 | $56,984 | $144,257 |
| 2022 | $2,162 | $197,296 | $55,867 | $141,429 |
| 2021 | $2,169 | $193,428 | $54,772 | $138,656 |
| 2020 | $2,102 | $191,446 | $54,211 | $137,235 |
| 2019 | $2,040 | $187,694 | $53,149 | $134,545 |
| 2018 | $2,017 | $184,014 | $52,107 | $131,907 |
| 2017 | $1,979 | $180,407 | $51,086 | $129,321 |
| 2016 | $1,913 | $176,871 | $50,085 | $126,786 |
| 2015 | $1,857 | $174,215 | $49,333 | $124,882 |
| 2014 | $1,786 | $170,803 | $48,367 | $122,436 |
Source: Public Records
Map
Nearby Homes
- 509 Rockledge St
- 1635 E Minnesota Ave Unit 1,3
- 503 505 N Nevada St
- 722 &718 N Freeman St
- 520 Grant St
- 911 Minnesota Ave
- 1120 Sea Glass Way
- 1121 Makena Way
- 909 Leonard Ave
- 301 S Horne St
- 324 S Nevada St
- 525 S Freeman St
- 122 Beechwood Ln
- 35 Parkwood Ln
- 1786 Jasmine Way
- 1009 S Coast Hwy
- 907 S Tremont St
- 522 S Cleveland St Unit 7
- 465 S Cleveland St Unit 103
- 1330 Bush St
Your Personal Tour Guide
Ask me questions while you tour the home.