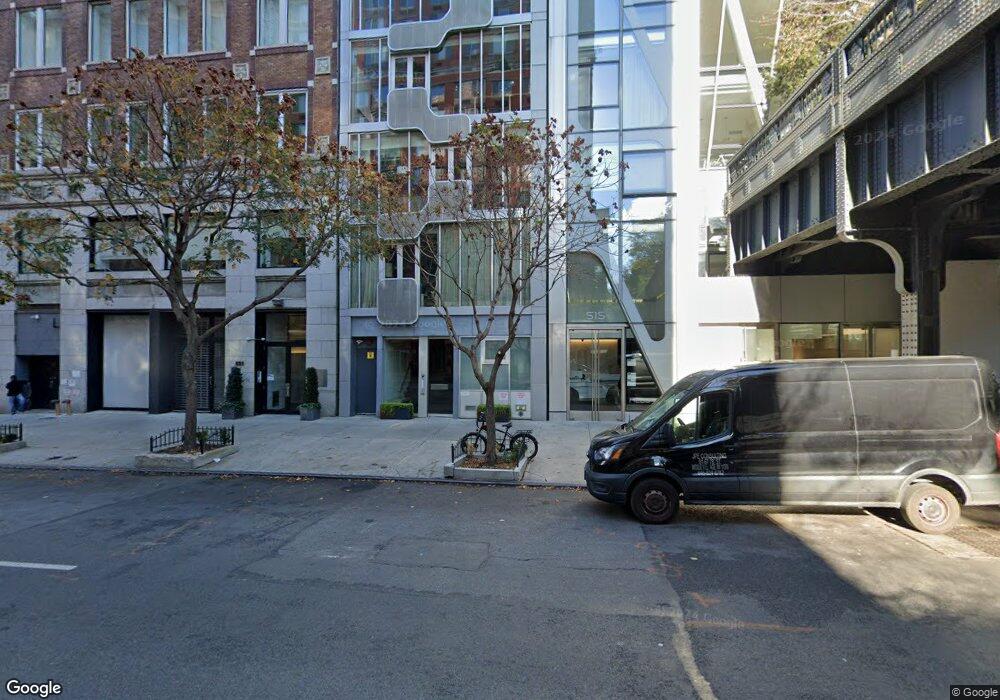
519 W 23rd St Unit R2 New York, NY 10011
Chelsea NeighborhoodEstimated Value: $2,280,000 - $2,711,919
--
Bed
--
Bath
1,696
Sq Ft
$1,456/Sq Ft
Est. Value
About This Home
This home is located at 519 W 23rd St Unit R2, New York, NY 10011 and is currently estimated at $2,468,980, approximately $1,455 per square foot. 519 W 23rd St Unit R2 is a home located in New York County with nearby schools including P.S. 11 Sarah J. Garnet School, Clinton School, and Middle School 297.
Ownership History
Date
Name
Owned For
Owner Type
Purchase Details
Closed on
Nov 9, 2010
Sold by
Pham Julie and Pham Nam
Bought by
Filicia Thomas Leonard
Current Estimated Value
Home Financials for this Owner
Home Financials are based on the most recent Mortgage that was taken out on this home.
Original Mortgage
$1,000,000
Outstanding Balance
$658,776
Interest Rate
4.24%
Mortgage Type
Purchase Money Mortgage
Estimated Equity
$1,810,204
Purchase Details
Closed on
Sep 14, 2009
Sold by
The Highline Park Llc
Bought by
Pham Julie and Pham Nam
Home Financials for this Owner
Home Financials are based on the most recent Mortgage that was taken out on this home.
Original Mortgage
$980,000
Interest Rate
5.12%
Mortgage Type
Purchase Money Mortgage
Create a Home Valuation Report for This Property
The Home Valuation Report is an in-depth analysis detailing your home's value as well as a comparison with similar homes in the area
Home Values in the Area
Average Home Value in this Area
Purchase History
| Date | Buyer | Sale Price | Title Company |
|---|---|---|---|
| Filicia Thomas Leonard | $1,575,000 | -- | |
| Pham Julie | $1,400,000 | -- |
Source: Public Records
Mortgage History
| Date | Status | Borrower | Loan Amount |
|---|---|---|---|
| Open | Filicia Thomas Leonard | $1,000,000 | |
| Previous Owner | Pham Julie | $980,000 |
Source: Public Records
Tax History Compared to Growth
Tax History
| Year | Tax Paid | Tax Assessment Tax Assessment Total Assessment is a certain percentage of the fair market value that is determined by local assessors to be the total taxable value of land and additions on the property. | Land | Improvement |
|---|---|---|---|---|
| 2025 | $26,113 | $211,311 | $20,871 | $190,440 |
| 2024 | $26,113 | $208,869 | $20,871 | $187,998 |
| 2023 | $25,184 | $205,300 | $20,871 | $184,429 |
| 2022 | $20,129 | $199,422 | $20,871 | $178,551 |
| 2021 | $24,463 | $199,422 | $20,871 | $178,551 |
| 2020 | $20,153 | $221,302 | $20,871 | $200,431 |
| 2019 | $23,746 | $198,553 | $20,871 | $177,682 |
| 2018 | $19,393 | $191,631 | $20,871 | $170,760 |
| 2017 | $19,143 | $193,648 | $20,871 | $172,777 |
| 2016 | $14,675 | $185,787 | $20,871 | $164,916 |
| 2015 | $4,474 | $183,421 | $20,871 | $162,550 |
| 2014 | $4,474 | $188,604 | $20,871 | $167,733 |
Source: Public Records
Map
Nearby Homes
- 515 W 23rd St Unit PH
- 515 W 23rd St Unit 6
- 515 W 23rd St Unit 5
- 509 W 23rd St
- 245 10th Ave Unit 5
- 245 10th Ave Unit 8
- 231 10th Ave Unit 5A
- 500 W 25th St Unit 8
- 520 W 23rd St Unit 8C
- 520 W 23rd St Unit 3H
- 520 W 23rd St Unit 14D
- 520 W 23rd St Unit 12B
- 470 W 24th St Unit 19B
- 470 W 24th St Unit 7GJ
- 470 W 24th St Unit 19C
- 470 W 24th St Unit 6A
- 470 W 24th St Unit 4F
- 465 W 23rd St Unit 2G
- 465 W 23rd St Unit 4G
- 465 W 23rd St Unit 19D
- 519 W 23rd St
- 519 W 23rd St Unit ID1013735P
- 519 W 23rd St Unit ID1013732P
- 520 W 23rd St Unit 6G
- 520 W 23rd St Unit 3G
- 519 W 23rd St
- 519 W 23rd St Unit R10
- 519 W 23rd St Unit R9
- 519 W 23rd St Unit R8
- 519 W 23rd St Unit R7
- 519 W 23rd St Unit R6
- 519 W 23rd St Unit R5
- 519 W 23rd St Unit R4
- 519 W 23rd St Unit R3
- 519 W 23rd St Unit R1
- 520 W 23rd St Unit 522
- 520 W 23rd St
- 519 W 23rd St Unit 6
- 519 W 23rd St Unit 3
- 519 W 23rd St Unit GARDEN