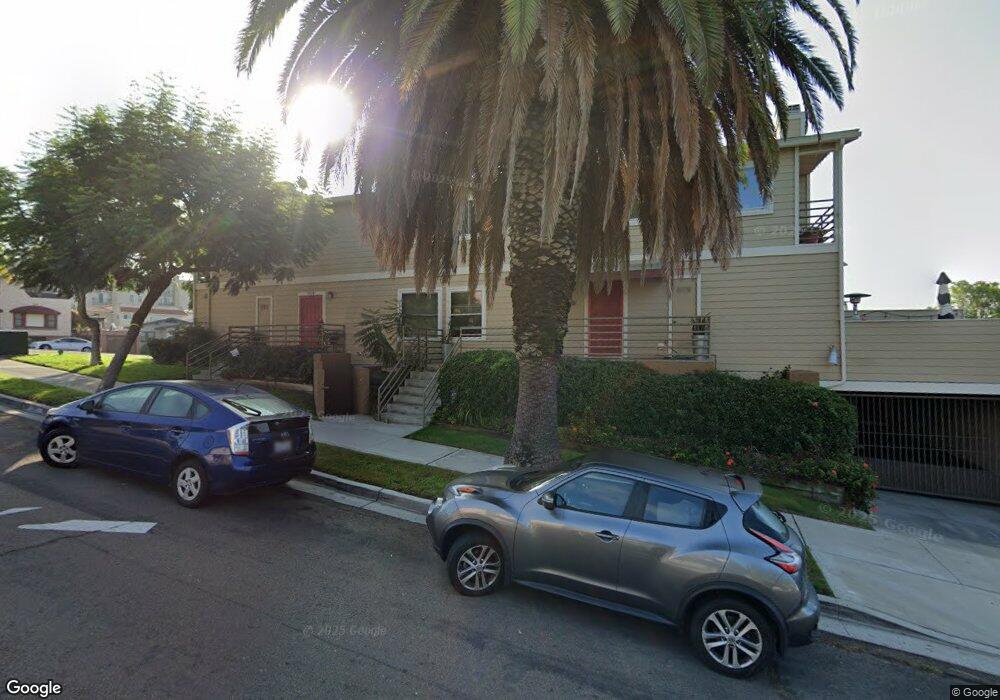
519 W Laurel St Unit 4 San Diego, CA 92101
Bankers Hill NeighborhoodEstimated Value: $735,000 - $967,000
2
Beds
2
Baths
1,139
Sq Ft
$753/Sq Ft
Est. Value
About This Home
This home is located at 519 W Laurel St Unit 4, San Diego, CA 92101 and is currently estimated at $857,313, approximately $752 per square foot. 519 W Laurel St Unit 4 is a home located in San Diego County with nearby schools including Washington Elementary School, Roosevelt International Middle School, and Museum School.
Ownership History
Date
Name
Owned For
Owner Type
Purchase Details
Closed on
Sep 25, 2012
Sold by
Thomas Paul and Thomas Jenny V
Bought by
Morgan Jason I and Riley Erin P
Current Estimated Value
Home Financials for this Owner
Home Financials are based on the most recent Mortgage that was taken out on this home.
Original Mortgage
$312,000
Outstanding Balance
$215,234
Interest Rate
3.43%
Mortgage Type
New Conventional
Estimated Equity
$642,079
Purchase Details
Closed on
Nov 20, 2002
Sold by
Harrison David and Harrison Dawn
Bought by
Thomas Paul
Home Financials for this Owner
Home Financials are based on the most recent Mortgage that was taken out on this home.
Original Mortgage
$322,700
Interest Rate
6.03%
Purchase Details
Closed on
Jul 1, 1997
Sold by
Ferolie Carl E and Andrews Pam L
Bought by
Minas Dawn
Home Financials for this Owner
Home Financials are based on the most recent Mortgage that was taken out on this home.
Original Mortgage
$152,000
Interest Rate
7.45%
Purchase Details
Closed on
Nov 1, 1988
Create a Home Valuation Report for This Property
The Home Valuation Report is an in-depth analysis detailing your home's value as well as a comparison with similar homes in the area
Home Values in the Area
Average Home Value in this Area
Purchase History
| Date | Buyer | Sale Price | Title Company |
|---|---|---|---|
| Morgan Jason I | $390,000 | Corinthian Title Company | |
| Thomas Paul | $435,000 | Fidelity National Title | |
| Minas Dawn | $160,000 | Chicago Title Co | |
| -- | $169,000 | -- |
Source: Public Records
Mortgage History
| Date | Status | Borrower | Loan Amount |
|---|---|---|---|
| Open | Morgan Jason I | $312,000 | |
| Previous Owner | Thomas Paul | $322,700 | |
| Previous Owner | Minas Dawn | $152,000 | |
| Closed | Thomas Paul | $90,500 |
Source: Public Records
Tax History Compared to Growth
Tax History
| Year | Tax Paid | Tax Assessment Tax Assessment Total Assessment is a certain percentage of the fair market value that is determined by local assessors to be the total taxable value of land and additions on the property. | Land | Improvement |
|---|---|---|---|---|
| 2025 | $5,728 | $480,243 | $364,792 | $115,451 |
| 2024 | $5,728 | $470,828 | $357,640 | $113,188 |
| 2023 | $5,600 | $461,597 | $350,628 | $110,969 |
| 2022 | $5,450 | $452,547 | $343,753 | $108,794 |
| 2021 | $5,411 | $443,674 | $337,013 | $106,661 |
| 2020 | $5,345 | $439,126 | $333,558 | $105,568 |
| 2019 | $5,248 | $430,517 | $327,018 | $103,499 |
| 2018 | $4,906 | $422,076 | $320,606 | $101,470 |
| 2017 | $4,788 | $413,801 | $314,320 | $99,481 |
| 2016 | $4,710 | $405,688 | $308,157 | $97,531 |
| 2015 | $4,639 | $399,595 | $303,529 | $96,066 |
| 2014 | $4,565 | $391,769 | $297,584 | $94,185 |
Source: Public Records
Map
Nearby Homes
- 450 W Laurel St
- 2453 Curlew St
- 2445 Brant St Unit 612
- 2445 Brant St Unit 613
- 2445 Brant St Unit 309
- 0 Reynard Way Unit PTP2505859
- 2410 Albatross St Unit 9
- 2371 Brant St
- 405 W Nutmeg St
- 230 W Laurel St Unit 601
- 230 W Laurel St Unit 506
- 2311 State St
- 2414 Front St Unit 31
- 2414 Front St Unit 11C
- 2730 Brant St
- 2715 Columbia St
- 2630 Front St
- 2266 Albatross St Unit B
- 2805 State St
- 2487 Kettner Blvd
- 519 W Laurel St Unit 3
- 519 W Laurel St Unit 1
- 2450 Horton Ave
- 529 W Laurel St
- 2444 Curlew St
- 2440 Curlew St Unit 44
- 2449 Union St Unit 59
- 2439 Union St Unit 43
- 2502 Horton Ave Unit 12
- 2428 Curlew St
- 583 W Laurel St
- 2431 Union St
- 586 W Laurel St Unit 2
- 586 W Laurel St Unit 3
- 586 W Laurel St
- 586 W Laurel St
- 590 W Laurel St Unit cndo
- 586 W Laurel St Unit condo
- 586 W Laurel St
- 590 W Laurel St