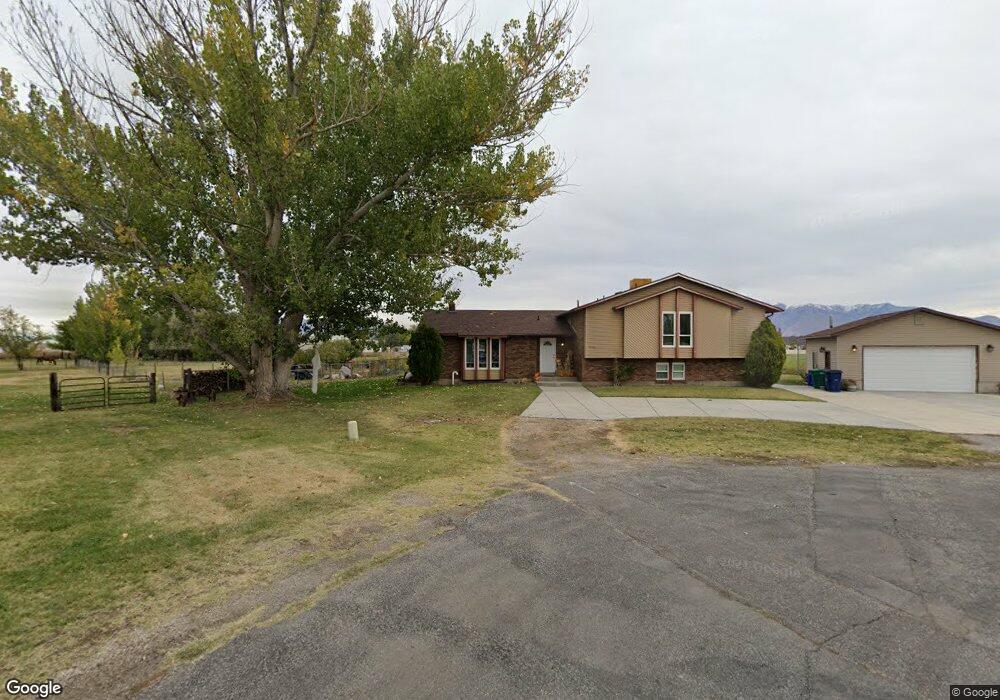
5194 W 4175 S Hooper, UT 84315
Estimated Value: $675,000 - $714,000
4
Beds
3
Baths
2,220
Sq Ft
$312/Sq Ft
Est. Value
About This Home
This home is located at 5194 W 4175 S, Hooper, UT 84315 and is currently estimated at $691,739, approximately $311 per square foot. 5194 W 4175 S is a home located in Weber County with nearby schools including Hooper Elementary School, Rocky Mountain Junior High School, and Quest Academy.
Ownership History
Date
Name
Owned For
Owner Type
Purchase Details
Closed on
Dec 23, 2021
Sold by
Stanger Family Trust
Bought by
Raeann Stanger Living Trust
Current Estimated Value
Purchase Details
Closed on
Jul 25, 2013
Sold by
Stanger Michael K and Stanger Raeann
Bought by
Stanger Michael K and Stanger Raeann
Purchase Details
Closed on
Oct 23, 2009
Sold by
Hainline Kim Lee and Hainline Rae Ann
Bought by
Stanger Michael K and Stanger Rae Ann
Home Financials for this Owner
Home Financials are based on the most recent Mortgage that was taken out on this home.
Original Mortgage
$93,610
Interest Rate
4.83%
Mortgage Type
FHA
Purchase Details
Closed on
Jul 12, 2006
Sold by
Hainline Kim L and Hainline Rae Ann
Bought by
Hainline Kim Lee and Hainline Rae Ann
Create a Home Valuation Report for This Property
The Home Valuation Report is an in-depth analysis detailing your home's value as well as a comparison with similar homes in the area
Home Values in the Area
Average Home Value in this Area
Purchase History
| Date | Buyer | Sale Price | Title Company |
|---|---|---|---|
| Raeann Stanger Living Trust | -- | None Listed On Document | |
| Stanger Michael K | -- | None Available | |
| Stanger Michael K | -- | First American Fashion Point | |
| Hainline Kim Lee | -- | None Available |
Source: Public Records
Mortgage History
| Date | Status | Borrower | Loan Amount |
|---|---|---|---|
| Previous Owner | Stanger Michael K | $93,610 |
Source: Public Records
Tax History Compared to Growth
Tax History
| Year | Tax Paid | Tax Assessment Tax Assessment Total Assessment is a certain percentage of the fair market value that is determined by local assessors to be the total taxable value of land and additions on the property. | Land | Improvement |
|---|---|---|---|---|
| 2025 | $3,618 | $631,034 | $217,844 | $413,190 |
| 2024 | $3,486 | $340,448 | $119,814 | $220,634 |
| 2023 | $3,705 | $358,600 | $119,814 | $238,786 |
| 2022 | $3,600 | $356,399 | $105,835 | $250,564 |
| 2021 | $3,033 | $505,999 | $102,667 | $403,332 |
| 2020 | $3,042 | $465,001 | $87,563 | $377,438 |
| 2019 | $3,023 | $437,000 | $63,270 | $373,730 |
| 2018 | $2,872 | $396,999 | $63,270 | $333,729 |
| 2017 | $2,525 | $338,000 | $64,080 | $273,920 |
| 2016 | $2,239 | $161,825 | $27,042 | $134,783 |
| 2015 | $2,145 | $152,748 | $24,383 | $128,365 |
| 2014 | $1,977 | $136,984 | $24,383 | $112,601 |
Source: Public Records
Map
Nearby Homes
- 3191 S 5100 St W Unit 1
- 4111 S 5350 W
- 4126 S 4950 W
- 5389 W 3850 S Unit 22
- 5417 W 3850 S
- 3245 S 4975 W Unit 13
- 3223 S 4975 W Unit 15
- 3257 S 4975 W Unit 12
- 3269 S 4975 W Unit 11
- 3233 S 4975 W Unit 14
- 3238 S 4950 W
- 3243 S 4950 W Unit 25
- 3263 S 4950 W Unit 24
- 3225 S 4950 W Unit 26
- 3198 S 4950 W Unit 29
- 3192 S 4950 W Unit 28
- 5478 W 3750 S
- 3910 Country Cove Way
- 3731 S 4975 W
- 4712 W 4100 S