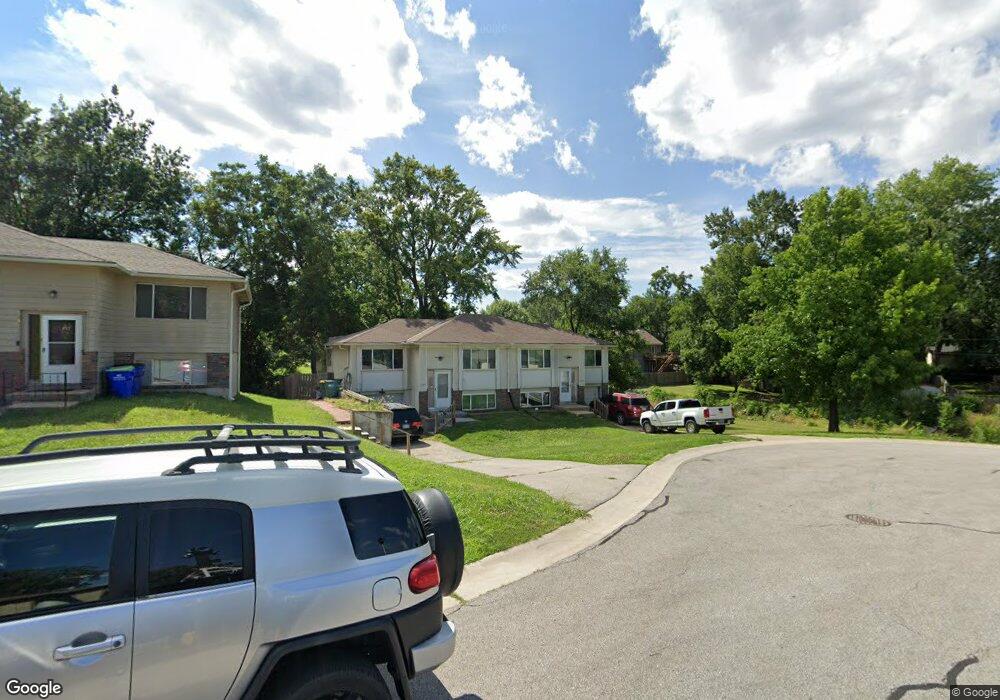
5196 Farley Ct Shawnee, KS 66203
Estimated Value: $304,000 - $324,564
4
Beds
4
Baths
1,464
Sq Ft
$214/Sq Ft
Est. Value
About This Home
This home is located at 5196 Farley Ct, Shawnee, KS 66203 and is currently estimated at $313,641, approximately $214 per square foot. 5196 Farley Ct is a home located in Johnson County with nearby schools including Merriam Park Elementary School, Hocker Grove Middle School, and Shawnee Mission North High School.
Ownership History
Date
Name
Owned For
Owner Type
Purchase Details
Closed on
Mar 29, 2024
Sold by
Srivisay Thavone
Bought by
Sanoubane Alan and Sanoubane Iamsouda
Current Estimated Value
Purchase Details
Closed on
Feb 4, 2022
Sold by
Sanoubane and Iamsouda
Bought by
Srivisay Thavone
Home Financials for this Owner
Home Financials are based on the most recent Mortgage that was taken out on this home.
Original Mortgage
$125,000
Interest Rate
3.55%
Mortgage Type
New Conventional
Purchase Details
Closed on
Feb 5, 2021
Sold by
Sanoubane Alan and Sanoubane Iamsouda
Bought by
Sanoubane Alan and Sanoubane Iamsouda
Purchase Details
Closed on
Sep 23, 2005
Sold by
Sanoubane Chanthala
Bought by
Sanoubane Alan and Sanoubane Iamsouda
Home Financials for this Owner
Home Financials are based on the most recent Mortgage that was taken out on this home.
Original Mortgage
$124,000
Interest Rate
6.37%
Mortgage Type
Adjustable Rate Mortgage/ARM
Create a Home Valuation Report for This Property
The Home Valuation Report is an in-depth analysis detailing your home's value as well as a comparison with similar homes in the area
Home Values in the Area
Average Home Value in this Area
Purchase History
| Date | Buyer | Sale Price | Title Company |
|---|---|---|---|
| Sanoubane Alan | -- | None Listed On Document | |
| Srivisay Thavone | -- | None Listed On Document | |
| Sanoubane Alan | -- | None Available | |
| Sanoubane Alan | -- | First American Title Insuran |
Source: Public Records
Mortgage History
| Date | Status | Borrower | Loan Amount |
|---|---|---|---|
| Previous Owner | Srivisay Thavone | $125,000 | |
| Previous Owner | Sanoubane Alan | $124,000 |
Source: Public Records
Tax History Compared to Growth
Tax History
| Year | Tax Paid | Tax Assessment Tax Assessment Total Assessment is a certain percentage of the fair market value that is determined by local assessors to be the total taxable value of land and additions on the property. | Land | Improvement |
|---|---|---|---|---|
| 2024 | $3,085 | $29,141 | $5,039 | $24,102 |
| 2023 | $2,893 | $27,749 | $5,039 | $22,710 |
| 2022 | $2,742 | $25,358 | $4,576 | $20,782 |
| 2021 | $2,589 | $22,816 | $4,156 | $18,660 |
| 2020 | $2,460 | $21,528 | $3,618 | $17,910 |
| 2019 | $2,400 | $20,987 | $3,144 | $17,843 |
| 2018 | $2,242 | $19,538 | $2,854 | $16,684 |
| 2017 | $2,564 | $19,090 | $2,854 | $16,236 |
| 2016 | $2,008 | $17,089 | $2,854 | $14,235 |
| 2015 | $1,986 | $17,031 | $2,854 | $14,177 |
| 2013 | -- | $16,019 | $2,854 | $13,165 |
Source: Public Records
Map
Nearby Homes
- 9929 W 52nd St
- 9719 W 53rd St
- 10116 W 52nd Terrace
- 5220 Hayes St
- 5003 Knox Ave
- 9328 W 51st St
- 0 W 49th St
- 5517 Hayes St
- 10511 W 49th Place
- The Fleetwood Plan at Bristol Highlands - The Villas
- The Fleetwood Plan at Bristol Highlands - The Manors
- The Kirkwood Plan at Bristol Highlands - The Villas
- 8013 Payne St
- The Rockwood Plan at Bristol Highlands - The Villas
- 9201 W 48th Terrace
- 9012 W 49th St
- 5405 Oliver St
- 11002 W 55th Terrace
- 8613 W 54th Terrace
- 5308 Mcanany Dr
- 5200 Farley Ct
- 9816 W 52nd St
- 5201 Farley Ln
- 5204 Farley Ct
- 5181 Farley Ln
- 5207 Farley Ln
- 9812 W 52nd St
- 5206 Farley Ct
- 5207 Farley Ln
- 5171 Farley Ln
- 9811 W 52nd St
- 5208 Farley Ct
- 9809 W 52nd St
- 5211 Farley Ln
- 9808 W 52nd St
- 9811 W 51st Place
- 9815 W 51st Place
- 5210 Farley Ct
- 5161 Farley Ln
- 5205 Farley Ct