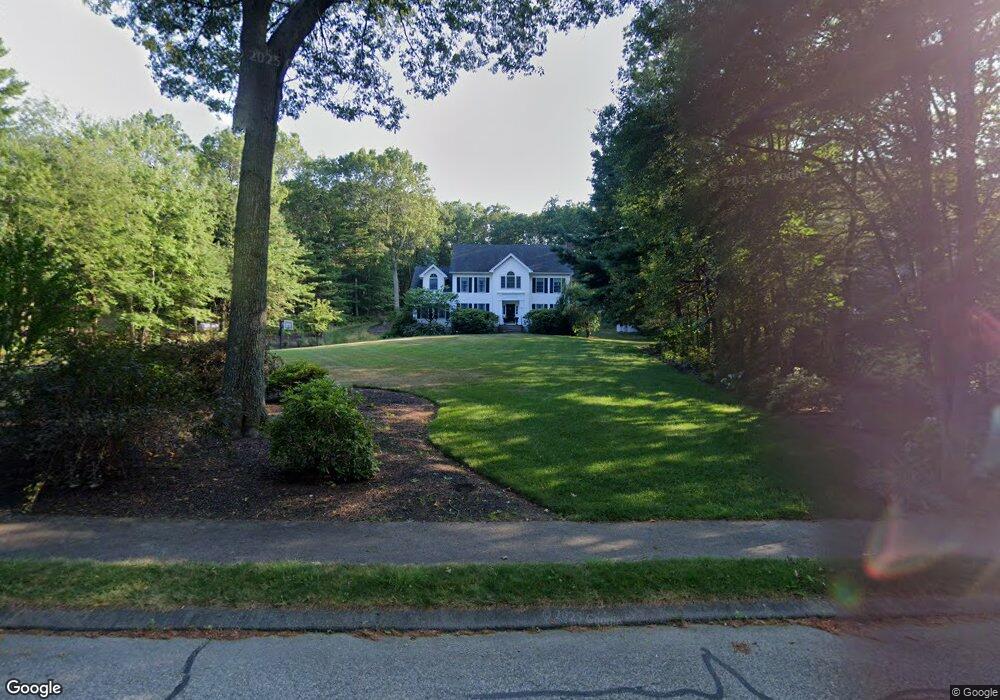
52 Cabral Dr Middleton, MA 01949
Estimated Value: $1,178,000 - $1,252,000
4
Beds
3
Baths
2,798
Sq Ft
$436/Sq Ft
Est. Value
About This Home
This home is located at 52 Cabral Dr, Middleton, MA 01949 and is currently estimated at $1,220,843, approximately $436 per square foot. 52 Cabral Dr is a home located in Essex County with nearby schools including Howe-Manning Elementary School, Fuller Meadow Elementary School, and Masconomet Regional Middle School.
Ownership History
Date
Name
Owned For
Owner Type
Purchase Details
Closed on
Jun 8, 1995
Sold by
Farmer C Alice
Bought by
Tonthat John C and Farmer Julie C
Current Estimated Value
Home Financials for this Owner
Home Financials are based on the most recent Mortgage that was taken out on this home.
Original Mortgage
$150,000
Interest Rate
8.21%
Mortgage Type
Purchase Money Mortgage
Create a Home Valuation Report for This Property
The Home Valuation Report is an in-depth analysis detailing your home's value as well as a comparison with similar homes in the area
Home Values in the Area
Average Home Value in this Area
Purchase History
| Date | Buyer | Sale Price | Title Company |
|---|---|---|---|
| Tonthat John C | $150,000 | -- | |
| Tonthat John C | $150,000 | -- |
Source: Public Records
Mortgage History
| Date | Status | Borrower | Loan Amount |
|---|---|---|---|
| Open | Tonthat John C | $250,000 | |
| Closed | Tonthat John C | $150,000 | |
| Closed | Tonthat John C | $100,000 |
Source: Public Records
Tax History Compared to Growth
Tax History
| Year | Tax Paid | Tax Assessment Tax Assessment Total Assessment is a certain percentage of the fair market value that is determined by local assessors to be the total taxable value of land and additions on the property. | Land | Improvement |
|---|---|---|---|---|
| 2025 | $12,636 | $1,062,700 | $441,900 | $620,800 |
| 2024 | $12,102 | $1,026,500 | $413,900 | $612,600 |
| 2023 | $11,686 | $908,000 | $451,900 | $456,100 |
| 2022 | $10,257 | $774,100 | $358,200 | $415,900 |
| 2021 | $10,153 | $740,000 | $340,200 | $399,800 |
| 2020 | $10,279 | $754,700 | $350,200 | $404,500 |
| 2019 | $9,990 | $729,700 | $334,200 | $395,500 |
| 2018 | $9,888 | $708,300 | $328,200 | $380,100 |
| 2017 | $9,165 | $657,000 | $282,200 | $374,800 |
| 2016 | $8,827 | $635,500 | $266,200 | $369,300 |
| 2015 | $8,666 | $628,900 | $262,200 | $366,700 |
Source: Public Records
Map
Nearby Homes
- 62 Cabral Dr
- 15 Couture Way
- 6 White Ln
- 2 Tyler Ln
- 1 Couture Way
- 119 River St
- 1 Overbrook Rd
- 1 Mills Point Unit 1
- 28 Niblick Way
- 44 Brassie Way
- 8 Brookside Rd
- 5 Theresa Rd
- 103 Elm St
- 1466 Main St
- 62 Catherine Dr
- 37 Peaslee Cir Unit 37
- Beverly Plan at Willis Brook at Lynnfield
- Sutton Plan at Willis Brook at Lynnfield
- Topsfield Plan at Willis Brook at Lynnfield
- Westford Plan at Willis Brook at Lynnfield