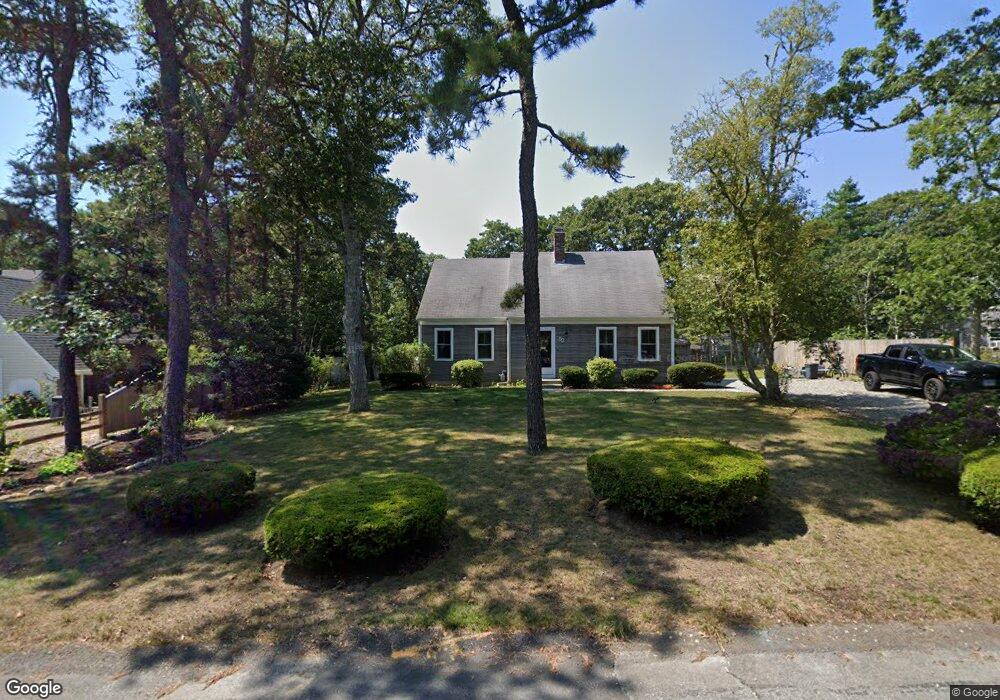
52 Captains Richards Way Chatham, MA 02633
West Chatham NeighborhoodEstimated Value: $791,000 - $1,463,000
3
Beds
2
Baths
1,722
Sq Ft
$626/Sq Ft
Est. Value
About This Home
This home is located at 52 Captains Richards Way, Chatham, MA 02633 and is currently estimated at $1,078,191, approximately $626 per square foot. 52 Captains Richards Way is a home located in Barnstable County with nearby schools including Chatham Elementary School, Harwich Elementary School, and Monomoy Regional Middle School.
Ownership History
Date
Name
Owned For
Owner Type
Purchase Details
Closed on
May 15, 2019
Sold by
Dobbins John F and Dobbins Teri D
Bought by
Birk Harold and Birk Susan L
Current Estimated Value
Purchase Details
Closed on
May 22, 2015
Sold by
Arnold Jeffrey H and Arnold Paula I
Bought by
Dobbins John F and Dobbins Teri D
Purchase Details
Closed on
Aug 7, 1992
Sold by
Blair Janice E
Bought by
Arnold Jeffrey H and Arnold Paula I
Home Financials for this Owner
Home Financials are based on the most recent Mortgage that was taken out on this home.
Original Mortgage
$97,000
Interest Rate
8.4%
Mortgage Type
Purchase Money Mortgage
Create a Home Valuation Report for This Property
The Home Valuation Report is an in-depth analysis detailing your home's value as well as a comparison with similar homes in the area
Home Values in the Area
Average Home Value in this Area
Purchase History
| Date | Buyer | Sale Price | Title Company |
|---|---|---|---|
| Birk Harold | $585,000 | -- | |
| Dobbins John F | $385,000 | -- | |
| Arnold Jeffrey H | $142,000 | -- |
Source: Public Records
Mortgage History
| Date | Status | Borrower | Loan Amount |
|---|---|---|---|
| Previous Owner | Arnold Jeffrey H | $97,000 | |
| Closed | Dobbins John F | $0 |
Source: Public Records
Tax History Compared to Growth
Tax History
| Year | Tax Paid | Tax Assessment Tax Assessment Total Assessment is a certain percentage of the fair market value that is determined by local assessors to be the total taxable value of land and additions on the property. | Land | Improvement |
|---|---|---|---|---|
| 2025 | $2,479 | $714,500 | $298,300 | $416,200 |
| 2024 | $2,407 | $674,300 | $281,400 | $392,900 |
| 2023 | $2,317 | $597,100 | $234,500 | $362,600 |
| 2022 | $2,244 | $485,700 | $234,500 | $251,200 |
| 2021 | $2,200 | $441,800 | $213,100 | $228,700 |
| 2020 | $2,075 | $430,600 | $213,100 | $217,500 |
| 2019 | $1,976 | $407,400 | $199,300 | $208,100 |
| 2018 | $1,891 | $388,300 | $199,300 | $189,000 |
| 2017 | $1,897 | $377,100 | $193,400 | $183,700 |
| 2016 | $1,920 | $382,500 | $189,700 | $192,800 |
| 2015 | $1,854 | $371,600 | $184,300 | $187,300 |
| 2014 | -- | $368,800 | $184,300 | $184,500 |
Source: Public Records
Map
Nearby Homes
- 144 Barn Hill Rd
- 14 Pond View Ln
- 0 George Ryder Rd Unit 73104629
- 0 George Ryder Rd Unit 22301591
- 1761 Main St
- 99 Uncle Alberts Drive Extension
- 200 Hardings Beach Rd
- 78 Indian Trail
- 92 Indian Trail
- 36 Moonbeam Ln
- 44 Buena Vista Rd
- 56 Skyline Dr
- 287 Cedar St
- 22 Pine Knoll Ave
- 207 Horizon Dr
- 85 Cedar St
- 0 Evergreen Ln
- 745 Main St
- 292 Stage Harbor Rd
- 231 Crowell Rd
- 52 Captain Richards Way
- 60 Captains Richards Way
- 44 Captains Richards Way
- 49 Captains Richards Way
- 55 Captain Richards Way
- 57 Captain Richards Way
- 66 Captains Richards Way
- 30 Captain Richards Way
- 57 Captains Richards Way
- 41 Captains Richards Way
- 30 Captains Richards Way
- 33 Captain Richards Way Unit 3
- 65 Captains Richards Way
- 65 Captain Richards Way
- 33 Captains Richards Way
- 37 Jessies Landing
- 74 Captains Richards Way
- 74 Captain Richards Way
- 41 Jessies Landing
- 41 Jessie's Landing