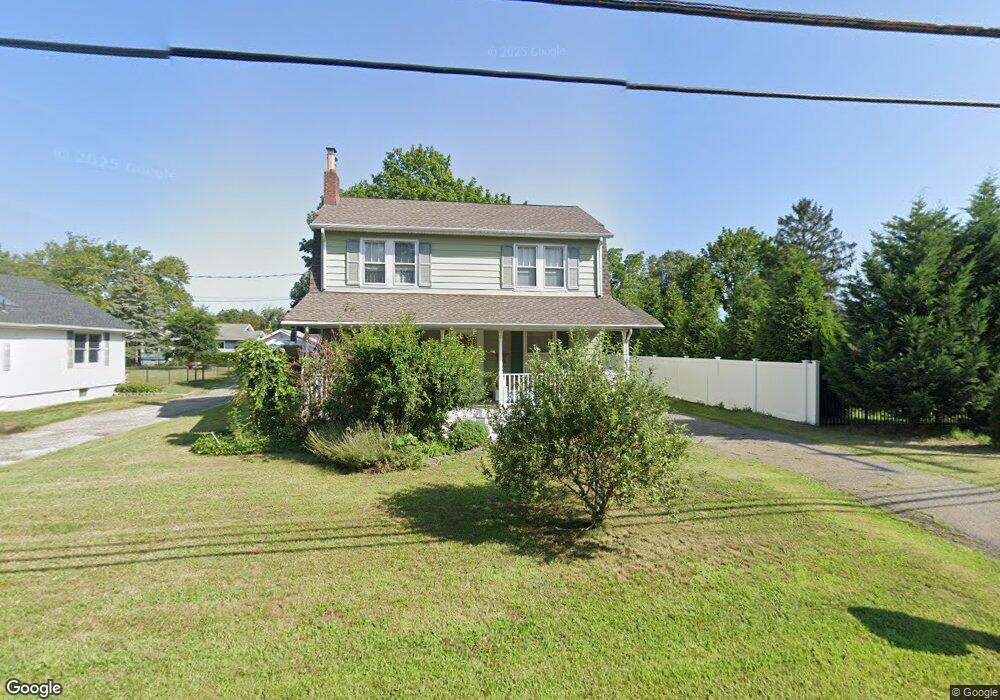
52 Cedar Grove Rd Toms River, NJ 08753
Estimated Value: $473,000 - $539,945
4
Beds
3
Baths
2,384
Sq Ft
$216/Sq Ft
Est. Value
About This Home
This home is located at 52 Cedar Grove Rd, Toms River, NJ 08753 and is currently estimated at $514,486, approximately $215 per square foot. 52 Cedar Grove Rd is a home located in Ocean County with nearby schools including St Joseph Grade School, Ambassador Christian Academy, and Donovan Catholic High School.
Ownership History
Date
Name
Owned For
Owner Type
Purchase Details
Closed on
Jun 20, 2002
Sold by
Boag James
Bought by
Gesser James and Gesser Stefany
Current Estimated Value
Home Financials for this Owner
Home Financials are based on the most recent Mortgage that was taken out on this home.
Original Mortgage
$120,000
Outstanding Balance
$50,128
Interest Rate
6.64%
Estimated Equity
$464,358
Purchase Details
Closed on
Feb 26, 1998
Sold by
Turner Kenneth A
Bought by
Boag James
Home Financials for this Owner
Home Financials are based on the most recent Mortgage that was taken out on this home.
Original Mortgage
$96,300
Interest Rate
6.87%
Purchase Details
Closed on
Apr 11, 1997
Sold by
Kelly Kevin
Bought by
Turner Brian and Turner Caroline
Home Financials for this Owner
Home Financials are based on the most recent Mortgage that was taken out on this home.
Original Mortgage
$108,000
Interest Rate
7.55%
Create a Home Valuation Report for This Property
The Home Valuation Report is an in-depth analysis detailing your home's value as well as a comparison with similar homes in the area
Home Values in the Area
Average Home Value in this Area
Purchase History
| Date | Buyer | Sale Price | Title Company |
|---|---|---|---|
| Gesser James | $160,000 | -- | |
| Boag James | $107,000 | Lawyers Title Insurance Corp | |
| Turner Brian | $114,000 | -- |
Source: Public Records
Mortgage History
| Date | Status | Borrower | Loan Amount |
|---|---|---|---|
| Open | Gesser James | $120,000 | |
| Previous Owner | Boag James | $96,300 | |
| Previous Owner | Turner Brian | $108,000 |
Source: Public Records
Tax History Compared to Growth
Tax History
| Year | Tax Paid | Tax Assessment Tax Assessment Total Assessment is a certain percentage of the fair market value that is determined by local assessors to be the total taxable value of land and additions on the property. | Land | Improvement |
|---|---|---|---|---|
| 2025 | $7,084 | $389,000 | $155,000 | $234,000 |
| 2024 | $6,734 | $389,000 | $155,000 | $234,000 |
| 2023 | $6,492 | $389,000 | $155,000 | $234,000 |
| 2022 | $6,492 | $389,000 | $155,000 | $234,000 |
| 2021 | $5,334 | $223,700 | $90,600 | $133,100 |
| 2020 | $5,579 | $223,700 | $90,600 | $133,100 |
| 2019 | $5,337 | $223,700 | $90,600 | $133,100 |
| 2018 | $5,266 | $223,700 | $90,600 | $133,100 |
| 2017 | $5,221 | $223,700 | $90,600 | $133,100 |
| 2016 | $5,085 | $223,700 | $90,600 | $133,100 |
| 2015 | $4,892 | $223,700 | $90,600 | $133,100 |
| 2014 | $4,657 | $223,700 | $90,600 | $133,100 |
Source: Public Records
Map
Nearby Homes
- 73 Cedar Grove Rd
- 523 Pheasant Ln
- 679 Clifton Ave
- 707 Cedar Point Ct
- 202 Terrace Ave
- 303 Terrace Ave
- 138 Walnut St
- 507 Terrace Ave
- 205 Dewey Dr Unit Pic your finish colo
- 508 Lafayette Ave
- 693 Clifton Ave
- 103 Dewey St
- 109 Twin Rivers Dr
- 830 Brookside Dr
- 16 Field St
- 505 Batchelor St
- 511 Batchelor St
- 1112 Formicola St
- 59 Grand Ave
- 23 Grant Ave
- 54 Cedar Grove Rd
- 50 Cedar Grove Rd
- 48 Cedar Grove Rd
- 409 Edken Ave
- 411 Edken Ave
- 57 Cedar Grove Rd
- 44 Cedar Grove Rd
- 49 Cedar Grove Rd
- 415 Edken Ave
- 61 Cedar Grove Rd
- 412 Edken Ave
- 417 Edken Ave
- 67 Cedar Grove Rd
- 915 Charles Dr
- 63 Cedar Grove Rd
- 419 Edken Ave
- 418 Edken Ave
- 69 Cedar Grove Rd
- 918 Charles Dr
- 423 Edken Ave