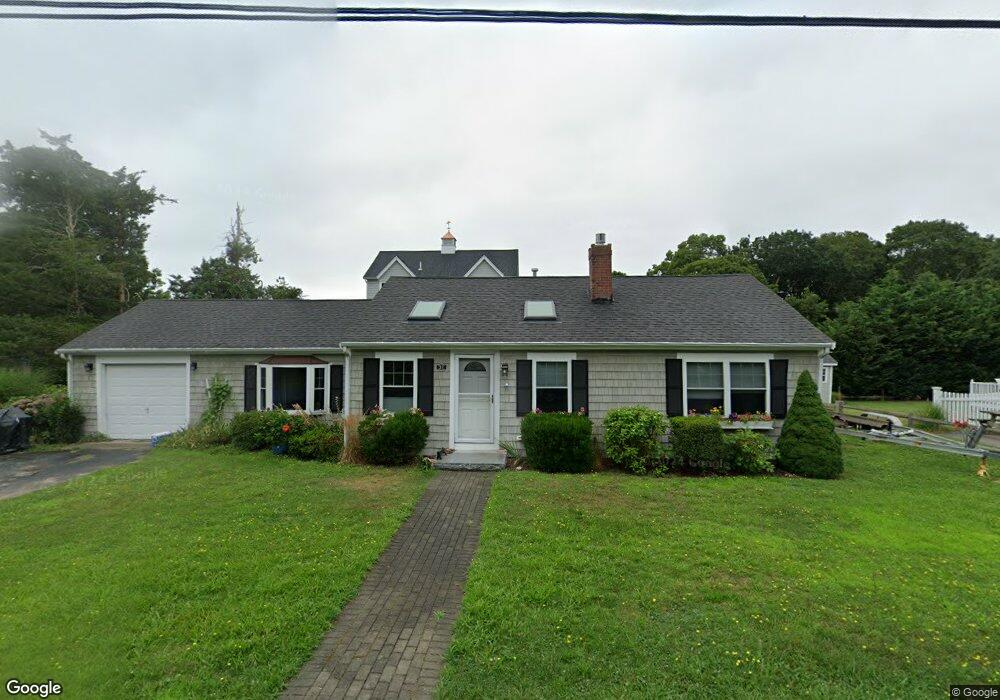
52 Cedar Point Dr Pocasset, MA 02559
Pocasset NeighborhoodEstimated Value: $684,000 - $768,000
2
Beds
1
Bath
1,190
Sq Ft
$621/Sq Ft
Est. Value
About This Home
This home is located at 52 Cedar Point Dr, Pocasset, MA 02559 and is currently estimated at $738,514, approximately $620 per square foot. 52 Cedar Point Dr is a home located in Barnstable County with nearby schools including Bourne High School and Cadence Academy Preschool - Bourne.
Ownership History
Date
Name
Owned For
Owner Type
Purchase Details
Closed on
Aug 12, 2009
Sold by
Shea Peter D and Shea Jane
Bought by
Shea Kevin and Shea Sheila G
Current Estimated Value
Home Financials for this Owner
Home Financials are based on the most recent Mortgage that was taken out on this home.
Original Mortgage
$200,000
Outstanding Balance
$130,331
Interest Rate
5.36%
Mortgage Type
Purchase Money Mortgage
Estimated Equity
$608,183
Create a Home Valuation Report for This Property
The Home Valuation Report is an in-depth analysis detailing your home's value as well as a comparison with similar homes in the area
Home Values in the Area
Average Home Value in this Area
Purchase History
| Date | Buyer | Sale Price | Title Company |
|---|---|---|---|
| Shea Kevin | $280,000 | -- | |
| Shea Kevin | $280,000 | -- |
Source: Public Records
Mortgage History
| Date | Status | Borrower | Loan Amount |
|---|---|---|---|
| Open | Shea Kevin | $200,000 | |
| Closed | Shea Kevin | $200,000 | |
| Previous Owner | Shea Kevin | $60,000 |
Source: Public Records
Tax History Compared to Growth
Tax History
| Year | Tax Paid | Tax Assessment Tax Assessment Total Assessment is a certain percentage of the fair market value that is determined by local assessors to be the total taxable value of land and additions on the property. | Land | Improvement |
|---|---|---|---|---|
| 2025 | $4,951 | $633,900 | $381,000 | $252,900 |
| 2024 | $4,841 | $603,600 | $362,800 | $240,800 |
| 2023 | $4,707 | $534,300 | $321,100 | $213,200 |
| 2022 | $4,252 | $421,400 | $251,900 | $169,500 |
| 2021 | $4,131 | $383,600 | $229,200 | $154,400 |
| 2020 | $4,017 | $374,000 | $227,000 | $147,000 |
| 2019 | $3,763 | $358,000 | $227,000 | $131,000 |
| 2018 | $3,590 | $340,600 | $221,800 | $118,800 |
| 2017 | $3,474 | $337,300 | $219,700 | $117,600 |
| 2016 | $3,260 | $320,900 | $208,700 | $112,200 |
| 2015 | $3,066 | $304,500 | $192,300 | $112,200 |
Source: Public Records
Map
Nearby Homes
- 22 Nairn Rd
- 48 Red Brook Harbor Rd
- 3 Red Brook Pond Dr
- 171 Bellavista Dr
- 1094 County Rd
- 940 County Rd
- 34 Kenwood Rd
- 45 Kenwood Rd
- 254 Barlows Landing Rd
- 70 Wings Neck Rd
- 75 Winsor Rd
- 10 Squeteague Harbor Rd
- 89 Harbor Dr
- 24 Richmond Rd
- 940 County Rd
- 1234 Route 28a
- 1234 Route 28a
- 709 County Rd
- 7 4th Ave
- 174 Barlows Landing Rd