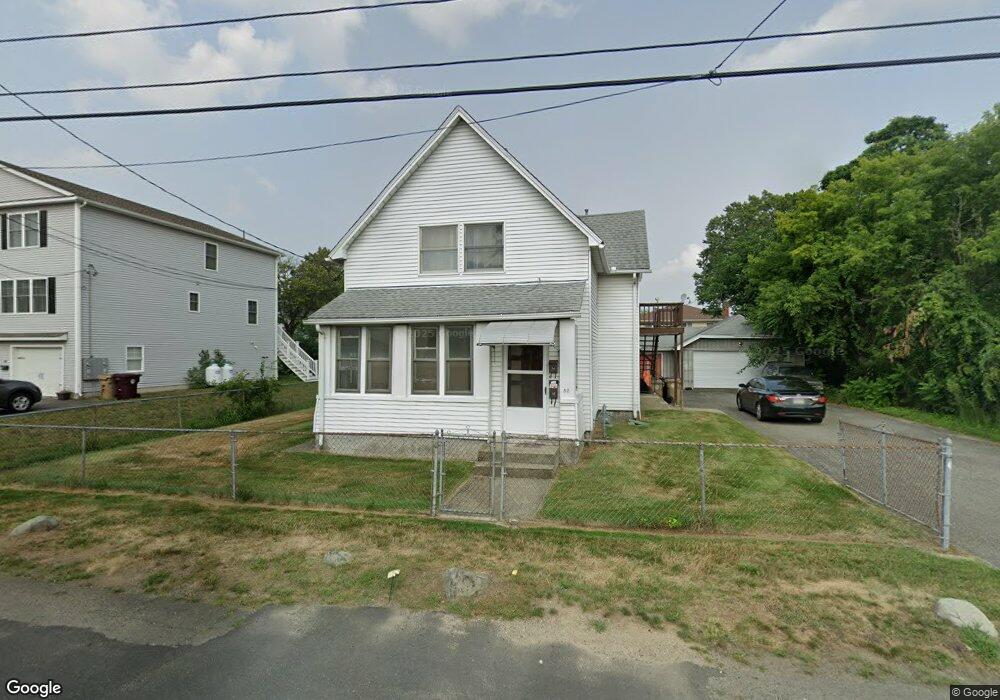
52 Cedar St Ludlow, MA 01056
Estimated Value: $334,476 - $435,000
4
Beds
2
Baths
2,200
Sq Ft
$177/Sq Ft
Est. Value
About This Home
This home is located at 52 Cedar St, Ludlow, MA 01056 and is currently estimated at $390,119, approximately $177 per square foot. 52 Cedar St is a home located in Hampden County with nearby schools including East Street Elementary School, Chapin Street Elementary School, and Paul R. Baird Middle School.
Ownership History
Date
Name
Owned For
Owner Type
Purchase Details
Closed on
Aug 27, 1990
Sold by
Genovevo Jose
Bought by
Santos Carlos A
Current Estimated Value
Home Financials for this Owner
Home Financials are based on the most recent Mortgage that was taken out on this home.
Original Mortgage
$100,000
Interest Rate
10.01%
Mortgage Type
Purchase Money Mortgage
Purchase Details
Closed on
Jul 28, 1988
Sold by
Dias Antonio
Bought by
Genovevo Jose
Home Financials for this Owner
Home Financials are based on the most recent Mortgage that was taken out on this home.
Original Mortgage
$78,000
Interest Rate
10.39%
Mortgage Type
Purchase Money Mortgage
Create a Home Valuation Report for This Property
The Home Valuation Report is an in-depth analysis detailing your home's value as well as a comparison with similar homes in the area
Home Values in the Area
Average Home Value in this Area
Purchase History
| Date | Buyer | Sale Price | Title Company |
|---|---|---|---|
| Santos Carlos A | $135,000 | -- | |
| Santos Carlos A | $135,000 | -- | |
| Genovevo Jose | $97,500 | -- |
Source: Public Records
Mortgage History
| Date | Status | Borrower | Loan Amount |
|---|---|---|---|
| Closed | Genovevo Jose | $100,000 | |
| Previous Owner | Genovevo Jose | $78,000 |
Source: Public Records
Tax History
| Year | Tax Paid | Tax Assessment Tax Assessment Total Assessment is a certain percentage of the fair market value that is determined by local assessors to be the total taxable value of land and additions on the property. | Land | Improvement |
|---|---|---|---|---|
| 2025 | $4,799 | $276,600 | $72,300 | $204,300 |
| 2024 | $4,385 | $242,400 | $72,300 | $170,100 |
| 2023 | $4,216 | $216,100 | $63,400 | $152,700 |
| 2022 | $4,170 | $208,600 | $63,400 | $145,200 |
| 2021 | $4,227 | $200,500 | $63,400 | $137,100 |
| 2020 | $4,048 | $196,300 | $62,400 | $133,900 |
| 2019 | $3,817 | $192,600 | $61,800 | $130,800 |
| 2018 | $3,703 | $194,800 | $61,800 | $133,000 |
| 2017 | $3,574 | $192,900 | $60,000 | $132,900 |
| 2016 | $3,390 | $187,000 | $58,800 | $128,200 |
| 2015 | $3,180 | $183,900 | $58,200 | $125,700 |
Source: Public Records
Map
Nearby Homes
- 31 Greenwich St
- 374 East St
- 59 Prospect St
- 162 Highland Ave
- 287 East St
- 37 Franklin St
- 63 Oak St
- 26 Swan Ave
- 25 Dale St
- 350 West Ave Unit 5
- 0 Center St Unit 73415933
- 42 Loopley St
- 84 Chapin Greene Dr
- 39 Rogers Ave
- 70 Sroka Ln
- 0 Fuller St Unit 73409741
- 70 Fuller St
- 102 Swan Ave
- 98 Fuller St Unit 32
- 12 Weston St
Your Personal Tour Guide
Ask me questions while you tour the home.