52 Clarke Cir Needham, MA 02492
Estimated Value: $2,638,000 - $3,367,000
5
Beds
5
Baths
4,275
Sq Ft
$684/Sq Ft
Est. Value
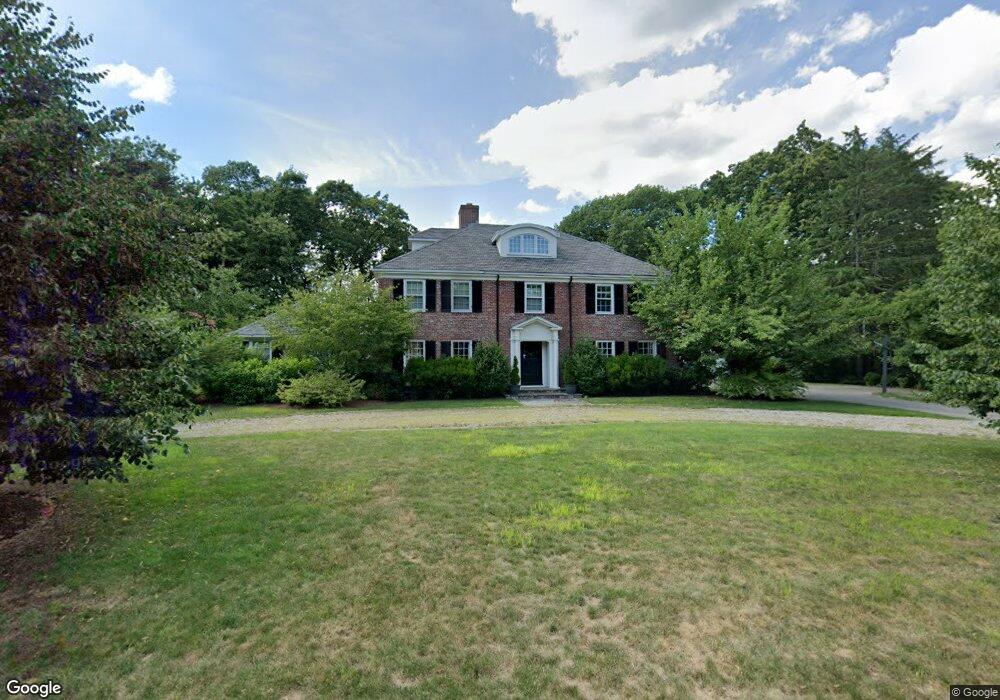
About This Home
This home is located at 52 Clarke Cir, Needham, MA 02492 and is currently estimated at $2,922,558, approximately $683 per square foot. 52 Clarke Cir is a home located in Norfolk County with nearby schools including Sunita L. Williams Elementary School, High Rock Middle School, and Pollard Middle School.
Ownership History
Date
Name
Owned For
Owner Type
Purchase Details
Closed on
Dec 30, 2005
Sold by
Jalkut Thomas P
Bought by
Vanputten Carolyn M and Vanputten Steven M
Current Estimated Value
Home Financials for this Owner
Home Financials are based on the most recent Mortgage that was taken out on this home.
Original Mortgage
$675,000
Outstanding Balance
$382,090
Interest Rate
6.39%
Mortgage Type
Purchase Money Mortgage
Estimated Equity
$2,540,468
Create a Home Valuation Report for This Property
The Home Valuation Report is an in-depth analysis detailing your home's value as well as a comparison with similar homes in the area
Home Values in the Area
Average Home Value in this Area
Purchase History
| Date | Buyer | Sale Price | Title Company |
|---|---|---|---|
| Vanputten Carolyn M | $1,225,000 | -- |
Source: Public Records
Mortgage History
| Date | Status | Borrower | Loan Amount |
|---|---|---|---|
| Open | Vanputten Carolyn M | $675,000 |
Source: Public Records
Tax History Compared to Growth
Tax History
| Year | Tax Paid | Tax Assessment Tax Assessment Total Assessment is a certain percentage of the fair market value that is determined by local assessors to be the total taxable value of land and additions on the property. | Land | Improvement |
|---|---|---|---|---|
| 2025 | $27,608 | $2,604,500 | $1,125,300 | $1,479,200 |
| 2024 | $21,623 | $1,727,100 | $632,900 | $1,094,200 |
| 2023 | $21,482 | $1,647,400 | $632,900 | $1,014,500 |
| 2022 | $20,760 | $1,552,700 | $587,900 | $964,800 |
| 2021 | $20,232 | $1,552,700 | $587,900 | $964,800 |
| 2020 | $19,862 | $1,590,200 | $587,900 | $1,002,300 |
| 2019 | $18,317 | $1,478,400 | $536,800 | $941,600 |
| 2018 | $17,563 | $1,478,400 | $536,800 | $941,600 |
| 2017 | $16,210 | $1,363,300 | $536,800 | $826,500 |
| 2016 | $13,997 | $1,212,900 | $536,800 | $676,100 |
| 2015 | $13,694 | $1,212,900 | $536,800 | $676,100 |
| 2014 | $13,330 | $1,145,200 | $490,300 | $654,900 |
Source: Public Records
Map
Nearby Homes
- 46 Lincoln Rd
- 98 Hunnewell St
- 12 Hill St
- 78 Hunnewell St
- 35 Andrea Cir
- 34 Pershing Rd
- 443 Central Ave
- 310 Oakland St
- 10 Fieldstone Way Unit 10
- 379 Hunnewell St Unit 379
- 381 Hunnewell St Unit 381
- 345 Central Ave
- 3 Crescent Rd
- 403 Hunnewell St Unit 403
- 98 Great Plain Ave
- 400 Hunnewell St Unit 103
- 132 Hillside Ave
- 445 Hillside Ave
- 7 Avery St
- 28 Clovelly Rd