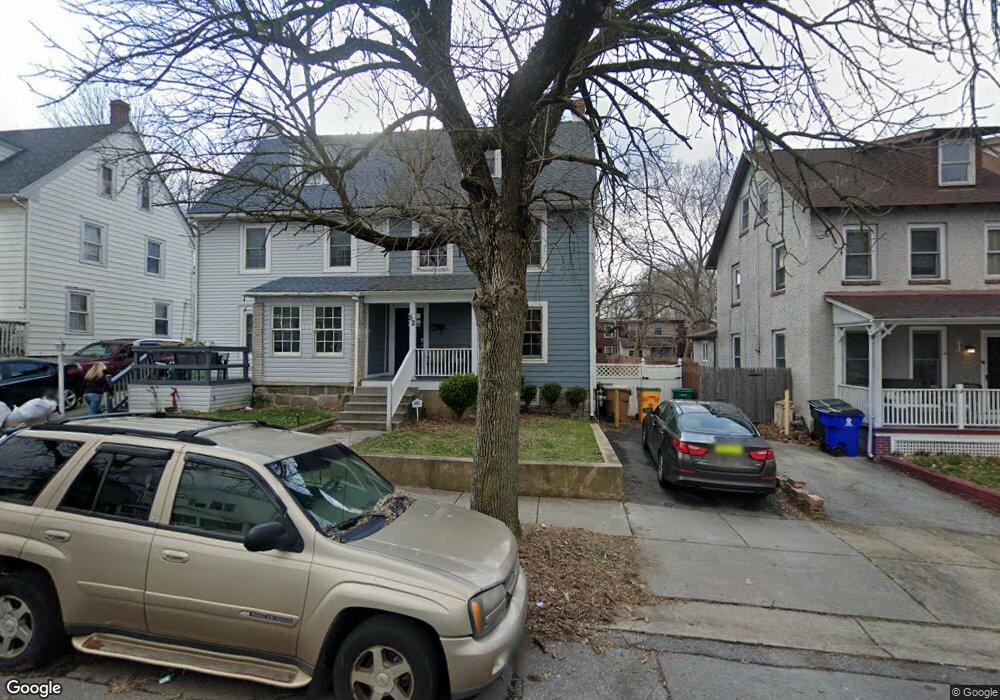
52 Colby Ave Claymont, DE 19703
Estimated Value: $175,000 - $258,568
3
Beds
2
Baths
1,525
Sq Ft
$146/Sq Ft
Est. Value
About This Home
This home is located at 52 Colby Ave, Claymont, DE 19703 and is currently estimated at $222,142, approximately $145 per square foot. 52 Colby Ave is a home located in New Castle County with nearby schools including Claymont Elementary School, Talley Middle School, and Brandywine High School.
Ownership History
Date
Name
Owned For
Owner Type
Purchase Details
Closed on
May 26, 2009
Sold by
New Knollwood Civic Association Inc
Bought by
Mundy Takisha
Current Estimated Value
Home Financials for this Owner
Home Financials are based on the most recent Mortgage that was taken out on this home.
Original Mortgage
$147,181
Interest Rate
5.31%
Mortgage Type
FHA
Purchase Details
Closed on
Dec 13, 2007
Sold by
Pinder Victor Albert
Bought by
Lasalle Bank Na and Certificates Holders Of Emc Mortgage Loa
Create a Home Valuation Report for This Property
The Home Valuation Report is an in-depth analysis detailing your home's value as well as a comparison with similar homes in the area
Home Values in the Area
Average Home Value in this Area
Purchase History
| Date | Buyer | Sale Price | Title Company |
|---|---|---|---|
| Mundy Takisha | $149,900 | None Available | |
| Lasalle Bank Na | $63,750 | None Available |
Source: Public Records
Mortgage History
| Date | Status | Borrower | Loan Amount |
|---|---|---|---|
| Previous Owner | Mundy Takisha | $147,181 |
Source: Public Records
Tax History Compared to Growth
Tax History
| Year | Tax Paid | Tax Assessment Tax Assessment Total Assessment is a certain percentage of the fair market value that is determined by local assessors to be the total taxable value of land and additions on the property. | Land | Improvement |
|---|---|---|---|---|
| 2024 | $1,292 | $33,100 | $4,900 | $28,200 |
| 2023 | $1,184 | $33,100 | $4,900 | $28,200 |
| 2022 | $1,198 | $33,100 | $4,900 | $28,200 |
| 2021 | $1,197 | $33,100 | $4,900 | $28,200 |
| 2020 | $1,197 | $33,100 | $4,900 | $28,200 |
| 2019 | $1,403 | $33,100 | $4,900 | $28,200 |
| 2018 | $1,145 | $33,100 | $4,900 | $28,200 |
| 2017 | $1,128 | $33,100 | $4,900 | $28,200 |
| 2016 | $1,125 | $33,100 | $4,900 | $28,200 |
| 2015 | $1,037 | $33,100 | $4,900 | $28,200 |
| 2014 | $1,037 | $33,100 | $4,900 | $28,200 |
Source: Public Records
Map
Nearby Homes
- 56 Colby Ave
- 26 Denham Ave
- 22 Colby Ave
- 447 Lenape Way
- 3858 Green St
- 227 Ridge Rd
- 1249 Parish Ave
- 1106 Sterling Ave
- 1721 Naamans Creek Rd
- 1813 Manor Ave
- 4039 Society Dr
- 12 Wistar St
- 3 Forrest Ave
- 4 Variton Dr
- 8 Commonwealth Ave
- 3048 Greenshire Ave
- 48 4th Ave
- 27303 Valley Run Dr Unit 303
- 120 Hilldale Ct
- 45 Osage Rd