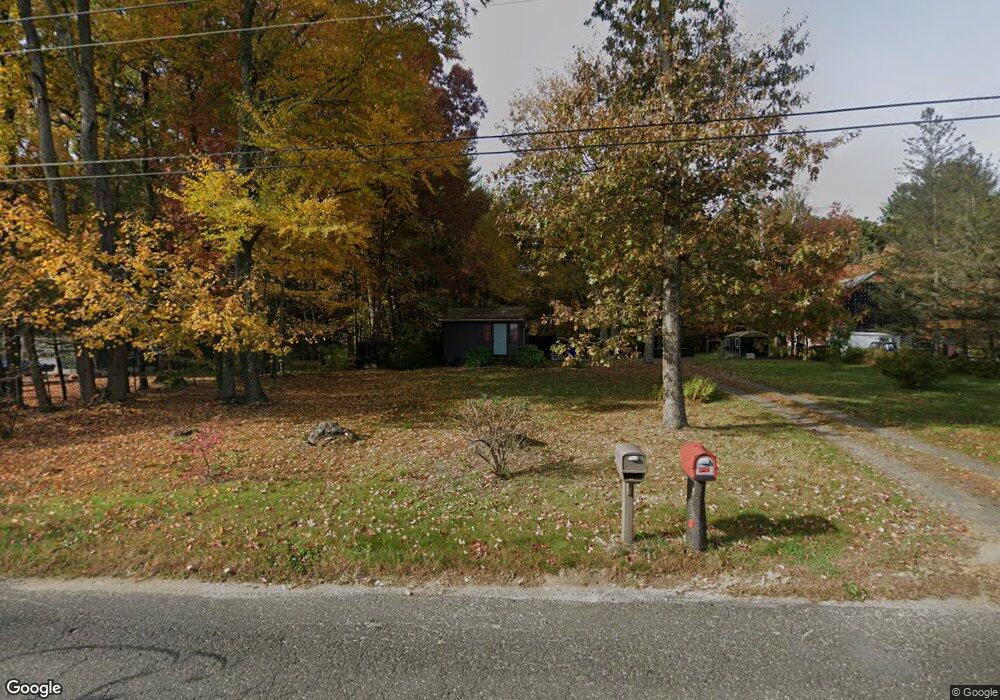
52 Coleman Rd Southampton, MA 01073
Estimated Value: $210,000 - $254,000
1
Bed
1
Bath
648
Sq Ft
$373/Sq Ft
Est. Value
About This Home
This home is located at 52 Coleman Rd, Southampton, MA 01073 and is currently estimated at $241,476, approximately $372 per square foot. 52 Coleman Rd is a home located in Hampshire County with nearby schools including William E Norris School, Hilltown Cooperative Charter Public School, and Calvary Baptist Christian School.
Ownership History
Date
Name
Owned For
Owner Type
Purchase Details
Closed on
Jun 28, 2007
Sold by
Herzig Werner Edward E and Herzig Edward
Bought by
Moreau Denise G
Current Estimated Value
Home Financials for this Owner
Home Financials are based on the most recent Mortgage that was taken out on this home.
Original Mortgage
$135,500
Outstanding Balance
$83,535
Interest Rate
6.24%
Mortgage Type
Purchase Money Mortgage
Estimated Equity
$157,941
Create a Home Valuation Report for This Property
The Home Valuation Report is an in-depth analysis detailing your home's value as well as a comparison with similar homes in the area
Home Values in the Area
Average Home Value in this Area
Purchase History
| Date | Buyer | Sale Price | Title Company |
|---|---|---|---|
| Moreau Denise G | $135,500 | -- |
Source: Public Records
Mortgage History
| Date | Status | Borrower | Loan Amount |
|---|---|---|---|
| Open | Moreau Denise G | $135,500 |
Source: Public Records
Tax History Compared to Growth
Tax History
| Year | Tax Paid | Tax Assessment Tax Assessment Total Assessment is a certain percentage of the fair market value that is determined by local assessors to be the total taxable value of land and additions on the property. | Land | Improvement |
|---|---|---|---|---|
| 2025 | $2,860 | $201,800 | $96,000 | $105,800 |
| 2024 | $2,807 | $197,000 | $96,000 | $101,000 |
| 2023 | $2,644 | $184,500 | $96,000 | $88,500 |
| 2022 | $2,569 | $170,500 | $87,000 | $83,500 |
| 2021 | $2,502 | $156,700 | $80,800 | $75,900 |
| 2020 | $2,427 | $153,400 | $80,800 | $72,600 |
| 2019 | $2,406 | $147,500 | $80,800 | $66,700 |
| 2018 | $2,244 | $134,200 | $72,500 | $61,700 |
| 2017 | $2,190 | $134,200 | $72,500 | $61,700 |
| 2015 | $2,011 | $128,000 | $66,300 | $61,700 |
Source: Public Records
Map
Nearby Homes
- 38 College Hwy
- 68 College Hwy
- 6 S St & Abutting Lots
- 26 Eastwood Ln
- 23 John St
- 13 Golden Dr
- 17 Glendale Rd
- 41 South St Unit 17
- 64 South St Unit 7
- 10 Parc Place Unit 2
- 1 Autumn Dr
- 12 Golden Cir
- 10 Golden Cir
- 63 Pomeroy St
- 125 Park St
- 385 Main St
- 26 Brook St
- M143 &152 Glendale St
- 11 Glendale St
- 43 Pomeroy Meadow Rd