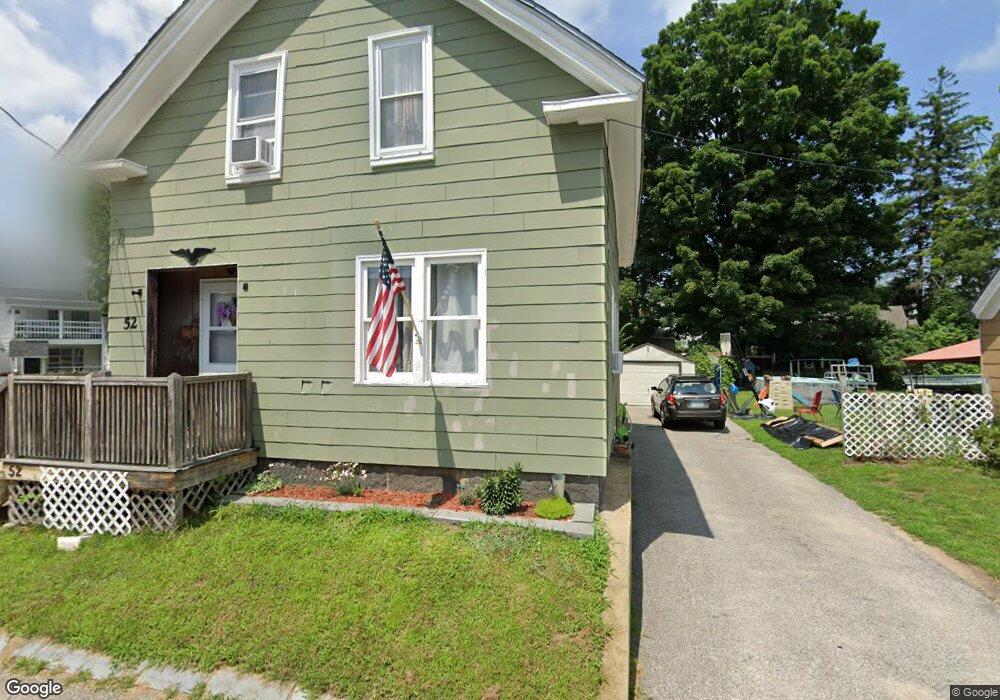
52 Concord St Concord, NH 03301
South End NeighborhoodEstimated Value: $350,000 - $430,000
4
Beds
1
Bath
1,174
Sq Ft
$319/Sq Ft
Est. Value
About This Home
This home is located at 52 Concord St, Concord, NH 03301 and is currently estimated at $374,646, approximately $319 per square foot. 52 Concord St is a home located in Merrimack County with nearby schools including Christa McAuliffe School, Rundlett Middle School, and Concord High School.
Ownership History
Date
Name
Owned For
Owner Type
Purchase Details
Closed on
Jan 5, 2018
Sold by
Lakeview Loan Servicin
Bought by
Ttgg Holdings 5 Llc
Current Estimated Value
Purchase Details
Closed on
Mar 23, 2017
Sold by
Maltais Christopher T
Bought by
Lakeview Loan Svcs Llc
Purchase Details
Closed on
Jun 22, 2012
Sold by
Maltais Alice R Est
Bought by
Maltais Christopher T
Create a Home Valuation Report for This Property
The Home Valuation Report is an in-depth analysis detailing your home's value as well as a comparison with similar homes in the area
Home Values in the Area
Average Home Value in this Area
Purchase History
| Date | Buyer | Sale Price | Title Company |
|---|---|---|---|
| Ttgg Holdings 5 Llc | $89,000 | -- | |
| Lakeview Loan Svcs Llc | $88,662 | -- | |
| Lakeview Loan Svcs Llc | $88,662 | -- | |
| Maltais Christopher T | $80,000 | -- | |
| Maltais Christopher T | $80,000 | -- |
Source: Public Records
Mortgage History
| Date | Status | Borrower | Loan Amount |
|---|---|---|---|
| Closed | Maltais Christopher T | $0 |
Source: Public Records
Tax History Compared to Growth
Tax History
| Year | Tax Paid | Tax Assessment Tax Assessment Total Assessment is a certain percentage of the fair market value that is determined by local assessors to be the total taxable value of land and additions on the property. | Land | Improvement |
|---|---|---|---|---|
| 2024 | $4,826 | $174,300 | $89,700 | $84,600 |
| 2023 | $4,682 | $174,300 | $89,700 | $84,600 |
| 2022 | $4,396 | $169,800 | $89,700 | $80,100 |
| 2021 | $4,421 | $176,000 | $89,700 | $86,300 |
| 2020 | $3,907 | $146,000 | $71,600 | $74,400 |
| 2019 | $3,603 | $129,700 | $66,600 | $63,100 |
| 2018 | $3,589 | $127,300 | $66,600 | $60,700 |
| 2017 | $3,490 | $123,600 | $66,600 | $57,000 |
| 2016 | $3,356 | $121,300 | $66,600 | $54,700 |
| 2015 | $3,161 | $116,600 | $65,200 | $51,400 |
| 2014 | $3,126 | $116,600 | $65,200 | $51,400 |
| 2013 | -- | $116,100 | $65,200 | $50,900 |
| 2012 | -- | $116,000 | $65,200 | $50,800 |
Source: Public Records
Map
Nearby Homes
- 47 South St
- 75 S State St
- 14-16 Perley St
- 14 Downing St
- 10 Perley St
- 4 Fayette St
- 54 Pleasant St Unit 8
- 87 S Main St Unit 2
- 0 Spruce St Unit 88
- 33 Spruce St
- 12 Avon St
- 24 Badger St
- 122 South St
- 17 Essex St
- 105 S Main St
- 2 Kensington Rd
- 0 South St Unit 4969509
- 30 Jackson St
- 1 Kensington Rd
- 22 Wilson Ave