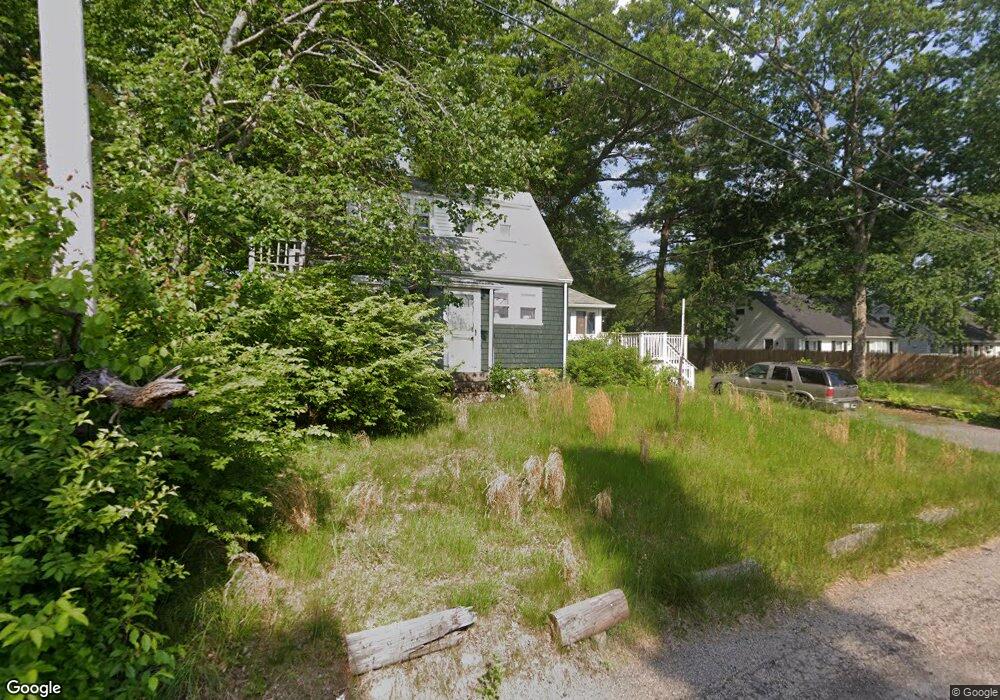
52 Dunbar St Brockton, MA 02302
Campello NeighborhoodEstimated Value: $344,000 - $428,000
2
Beds
2
Baths
720
Sq Ft
$540/Sq Ft
Est. Value
About This Home
This home is located at 52 Dunbar St, Brockton, MA 02302 and is currently estimated at $388,564, approximately $539 per square foot. 52 Dunbar St is a home located in Plymouth County with nearby schools including Davis K-8 School, John F. Kennedy Elementary School, and South Middle School.
Ownership History
Date
Name
Owned For
Owner Type
Purchase Details
Closed on
Dec 18, 2015
Sold by
Oconnor Thaddeus P
Bought by
Ingargiola James
Current Estimated Value
Home Financials for this Owner
Home Financials are based on the most recent Mortgage that was taken out on this home.
Original Mortgage
$145,500
Outstanding Balance
$115,142
Interest Rate
3.89%
Mortgage Type
New Conventional
Estimated Equity
$273,422
Create a Home Valuation Report for This Property
The Home Valuation Report is an in-depth analysis detailing your home's value as well as a comparison with similar homes in the area
Home Values in the Area
Average Home Value in this Area
Purchase History
| Date | Buyer | Sale Price | Title Company |
|---|---|---|---|
| Ingargiola James | $150,000 | -- |
Source: Public Records
Mortgage History
| Date | Status | Borrower | Loan Amount |
|---|---|---|---|
| Open | Ingargiola James | $145,500 |
Source: Public Records
Tax History Compared to Growth
Tax History
| Year | Tax Paid | Tax Assessment Tax Assessment Total Assessment is a certain percentage of the fair market value that is determined by local assessors to be the total taxable value of land and additions on the property. | Land | Improvement |
|---|---|---|---|---|
| 2025 | $3,512 | $290,000 | $161,700 | $128,300 |
| 2024 | $3,393 | $282,300 | $161,700 | $120,600 |
| 2023 | $3,837 | $295,600 | $112,100 | $183,500 |
| 2022 | $3,504 | $250,800 | $101,900 | $148,900 |
| 2021 | $3,181 | $219,400 | $95,000 | $124,400 |
| 2020 | $3,281 | $216,600 | $83,200 | $133,400 |
| 2019 | $2,824 | $181,700 | $79,600 | $102,100 |
| 2018 | $2,672 | $166,400 | $79,600 | $86,800 |
| 2017 | $2,383 | $148,000 | $79,600 | $68,400 |
| 2016 | $2,462 | $141,800 | $75,900 | $65,900 |
| 2015 | $2,383 | $131,300 | $75,900 | $55,400 |
| 2014 | $2,199 | $121,300 | $75,900 | $45,400 |
Source: Public Records
Map
Nearby Homes