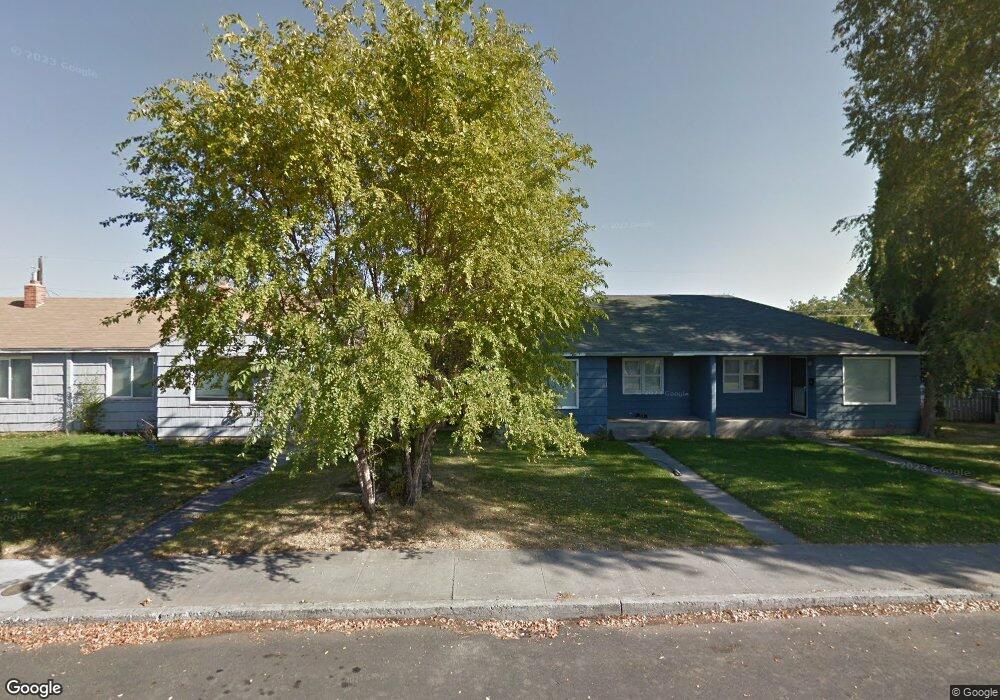
52 G St NE Ephrata, WA 98823
Estimated Value: $233,000 - $277,000
2
Beds
2
Baths
1,440
Sq Ft
$180/Sq Ft
Est. Value
About This Home
This home is located at 52 G St NE, Ephrata, WA 98823 and is currently estimated at $259,469, approximately $180 per square foot. 52 G St NE is a home located in Grant County with nearby schools including Ephrata High School, New Life Christian School, and St. Rose of Lima Catholic School.
Ownership History
Date
Name
Owned For
Owner Type
Purchase Details
Closed on
Nov 18, 2011
Sold by
Pacific Crest Savings Bank
Bought by
Weeks Daniel S and Weeks Danielle L
Current Estimated Value
Purchase Details
Closed on
Jul 27, 2011
Sold by
Babbitt Properties Llc
Bought by
Pacific Crest Savings Bank
Purchase Details
Closed on
Feb 22, 2006
Sold by
White John L and White Jewell L
Bought by
Babbitt Properties Llc
Home Financials for this Owner
Home Financials are based on the most recent Mortgage that was taken out on this home.
Original Mortgage
$68,000
Interest Rate
7.25%
Mortgage Type
Fannie Mae Freddie Mac
Create a Home Valuation Report for This Property
The Home Valuation Report is an in-depth analysis detailing your home's value as well as a comparison with similar homes in the area
Home Values in the Area
Average Home Value in this Area
Purchase History
| Date | Buyer | Sale Price | Title Company |
|---|---|---|---|
| Weeks Daniel S | $61,000 | Stewart Title | |
| Pacific Crest Savings Bank | $68,000 | Grant County Title | |
| Babbitt Properties Llc | $79,888 | Security Title Guara |
Source: Public Records
Mortgage History
| Date | Status | Borrower | Loan Amount |
|---|---|---|---|
| Previous Owner | Babbitt Properties Llc | $68,000 |
Source: Public Records
Tax History Compared to Growth
Tax History
| Year | Tax Paid | Tax Assessment Tax Assessment Total Assessment is a certain percentage of the fair market value that is determined by local assessors to be the total taxable value of land and additions on the property. | Land | Improvement |
|---|---|---|---|---|
| 2024 | $1,858 | $164,390 | $23,500 | $140,890 |
| 2023 | $1,463 | $100,150 | $23,500 | $76,650 |
| 2022 | $1,255 | $100,150 | $23,500 | $76,650 |
| 2021 | $1,187 | $100,150 | $23,500 | $76,650 |
| 2020 | $1,144 | $90,380 | $23,500 | $66,880 |
| 2019 | $1,105 | $103,755 | $23,500 | $80,255 |
| 2018 | $1,098 | $75,445 | $20,000 | $55,445 |
| 2017 | $1,004 | $73,630 | $20,000 | $53,630 |
| 2016 | $1,012 | $68,750 | $20,000 | $48,750 |
| 2013 | -- | $73,620 | $20,000 | $53,620 |
Source: Public Records
Map
Nearby Homes