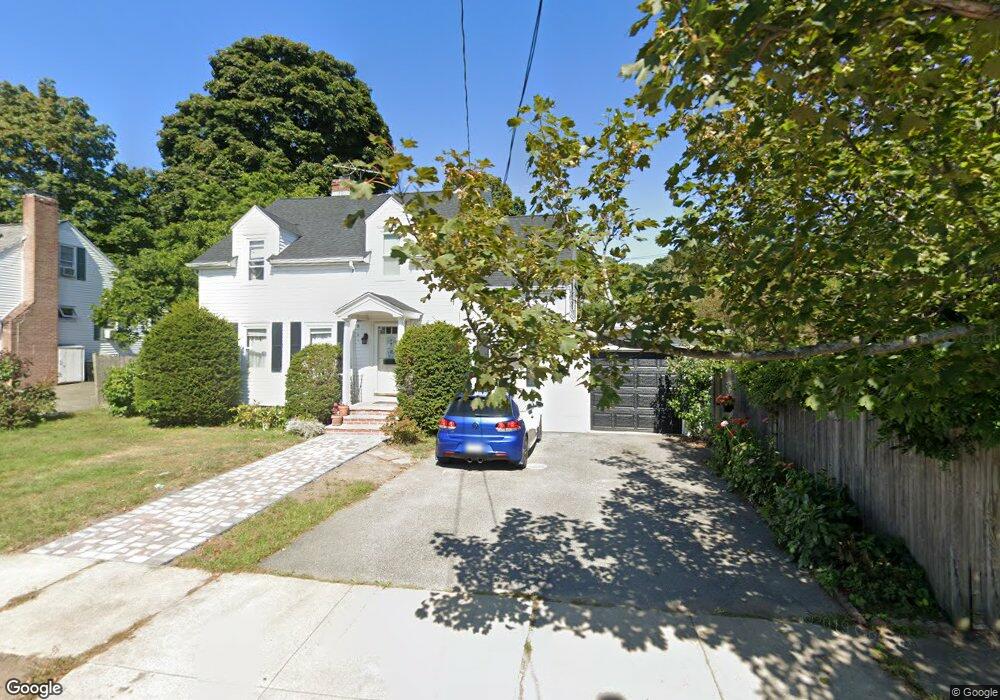
52 Gorham Ave Stoneham, MA 02180
Haywardville NeighborhoodEstimated Value: $823,000 - $979,000
4
Beds
3
Baths
2,115
Sq Ft
$423/Sq Ft
Est. Value
About This Home
This home is located at 52 Gorham Ave, Stoneham, MA 02180 and is currently estimated at $894,807, approximately $423 per square foot. 52 Gorham Ave is a home located in Middlesex County with nearby schools including Stoneham High School, Greater Boston Academy, and St. Patrick Elementary School.
Ownership History
Date
Name
Owned For
Owner Type
Purchase Details
Closed on
Aug 28, 1996
Sold by
Rivas Marco G and Rivas Olga E
Bought by
Costa Antonio and Costa Maria
Current Estimated Value
Home Financials for this Owner
Home Financials are based on the most recent Mortgage that was taken out on this home.
Original Mortgage
$100,000
Interest Rate
8.18%
Mortgage Type
Purchase Money Mortgage
Purchase Details
Closed on
Jan 30, 1987
Sold by
Confer Southern Ne
Bought by
Rivas Marco G
Create a Home Valuation Report for This Property
The Home Valuation Report is an in-depth analysis detailing your home's value as well as a comparison with similar homes in the area
Home Values in the Area
Average Home Value in this Area
Purchase History
| Date | Buyer | Sale Price | Title Company |
|---|---|---|---|
| Costa Antonio | $210,000 | -- | |
| Costa Antonio | $210,000 | -- | |
| Rivas Marco G | $150,400 | -- |
Source: Public Records
Mortgage History
| Date | Status | Borrower | Loan Amount |
|---|---|---|---|
| Open | Rivas Marco G | $103,000 | |
| Closed | Rivas Marco G | $100,000 | |
| Previous Owner | Rivas Marco G | $30,000 |
Source: Public Records
Tax History
| Year | Tax Paid | Tax Assessment Tax Assessment Total Assessment is a certain percentage of the fair market value that is determined by local assessors to be the total taxable value of land and additions on the property. | Land | Improvement |
|---|---|---|---|---|
| 2025 | $7,440 | $727,300 | $380,700 | $346,600 |
| 2024 | $7,240 | $683,700 | $350,700 | $333,000 |
| 2023 | $7,027 | $633,100 | $320,700 | $312,400 |
| 2022 | $6,080 | $584,100 | $290,700 | $293,400 |
| 2021 | $6,158 | $569,100 | $280,700 | $288,400 |
| 2020 | $5,935 | $550,000 | $270,700 | $279,300 |
| 2019 | $5,816 | $518,400 | $250,700 | $267,700 |
| 2018 | $5,855 | $500,000 | $230,700 | $269,300 |
| 2017 | $5,844 | $471,700 | $220,700 | $251,000 |
| 2016 | $5,761 | $453,600 | $220,700 | $232,900 |
| 2015 | $5,479 | $422,800 | $210,700 | $212,100 |
| 2014 | $5,472 | $405,600 | $200,700 | $204,900 |
Source: Public Records
Map
Nearby Homes
- 7 Carol St
- 6 Everett St
- 146 Marble St Unit 507
- 13 Wright St
- 137 Franklin St Unit 406
- 17 Franklin St
- 57 Park St
- 159 Franklin St Unit D2
- 159 Franklin St Unit C2
- 159 Franklin St Unit E6
- 177 Franklin St Unit 2
- 5 Chapel Way
- 53 Perkins St
- 33 Lake Ave
- 2 Mason Way Unit 6524
- 6 Mason Way Unit 63
- 10 Pomeworth St Unit A
- 51 Spring St
- 31 Tamarock Terrace
- 100 Ledgewood Dr Unit 410
Your Personal Tour Guide
Ask me questions while you tour the home.