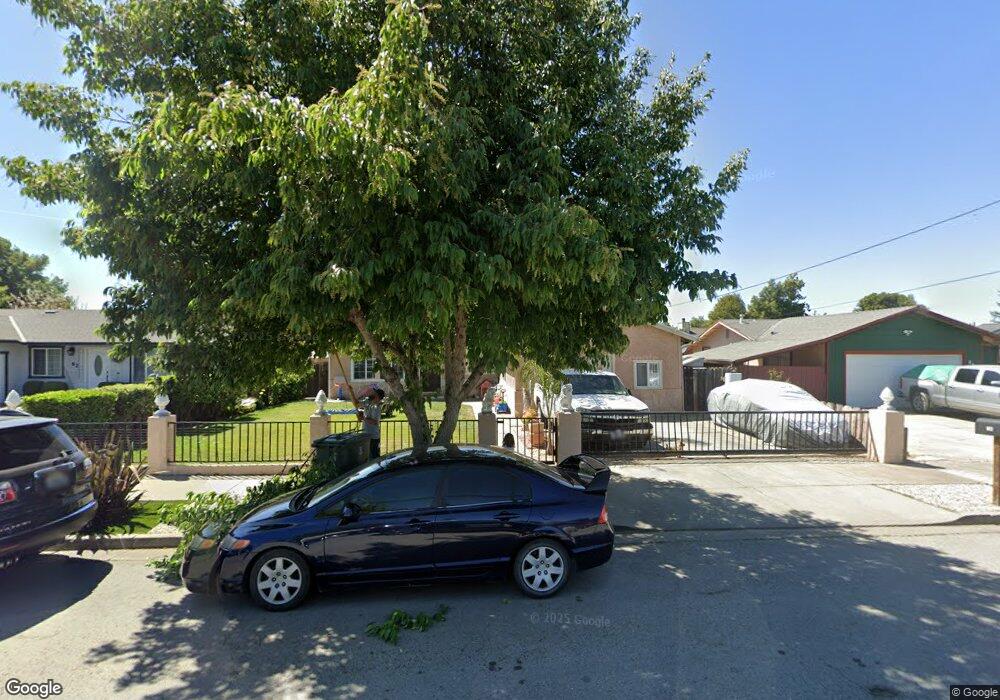
52 Line St Hollister, CA 95023
Estimated Value: $593,000 - $864,000
--
Bed
--
Bath
--
Sq Ft
6,708
Sq Ft Lot
About This Home
This home is located at 52 Line St, Hollister, CA 95023 and is currently estimated at $683,626. 52 Line St is a home located in San Benito County with nearby schools including Calaveras Elementary School, Maze Middle School, and San Benito High School.
Ownership History
Date
Name
Owned For
Owner Type
Purchase Details
Closed on
Jan 3, 2006
Sold by
Vasquez Rafael and Machuca Delfino
Bought by
Machuca Delfino
Current Estimated Value
Home Financials for this Owner
Home Financials are based on the most recent Mortgage that was taken out on this home.
Original Mortgage
$36,500
Interest Rate
5.8%
Mortgage Type
Stand Alone Second
Purchase Details
Closed on
Mar 17, 2003
Sold by
Hernandez Elvira and Hernandez Francisco
Bought by
Vasquez Rafael and Manchuca Delfino
Home Financials for this Owner
Home Financials are based on the most recent Mortgage that was taken out on this home.
Original Mortgage
$279,120
Interest Rate
6.35%
Purchase Details
Closed on
Mar 29, 2000
Sold by
Francisco Hernandez and Hernandez Alejandro
Bought by
Hernandez Francisco and Hernandez Elvira
Home Financials for this Owner
Home Financials are based on the most recent Mortgage that was taken out on this home.
Original Mortgage
$192,000
Interest Rate
8.3%
Create a Home Valuation Report for This Property
The Home Valuation Report is an in-depth analysis detailing your home's value as well as a comparison with similar homes in the area
Home Values in the Area
Average Home Value in this Area
Purchase History
| Date | Buyer | Sale Price | Title Company |
|---|---|---|---|
| Machuca Delfino | -- | Fidelity Natl Title Co Of Ca | |
| Machuca Delfino | -- | Fidelity Natl Title Co Of Ca | |
| Vasquez Rafael | $349,000 | Chicago Title Co | |
| Hernandez Francisco | -- | Fidelity National Title Ins |
Source: Public Records
Mortgage History
| Date | Status | Borrower | Loan Amount |
|---|---|---|---|
| Closed | Machuca Delfino | $36,500 | |
| Open | Machuca Delfino | $420,000 | |
| Closed | Machuca Delfino | $420,000 | |
| Closed | Vasquez Rafael | $279,120 | |
| Previous Owner | Hernandez Francisco | $192,000 | |
| Closed | Vasquez Rafael | $69,780 |
Source: Public Records
Tax History Compared to Growth
Tax History
| Year | Tax Paid | Tax Assessment Tax Assessment Total Assessment is a certain percentage of the fair market value that is determined by local assessors to be the total taxable value of land and additions on the property. | Land | Improvement |
|---|---|---|---|---|
| 2025 | $6,185 | $505,961 | $232,026 | $273,935 |
| 2023 | $6,185 | $486,316 | $223,017 | $263,299 |
| 2022 | $5,969 | $476,782 | $218,645 | $258,137 |
| 2021 | $5,886 | $467,434 | $214,358 | $253,076 |
| 2020 | $5,909 | $462,643 | $212,161 | $250,482 |
| 2019 | $5,738 | $453,572 | $208,001 | $245,571 |
| 2018 | $5,618 | $444,679 | $203,923 | $240,756 |
| 2017 | $5,541 | $435,961 | $199,925 | $236,036 |
| 2016 | $5,219 | $427,413 | $196,005 | $231,408 |
| 2015 | $4,447 | $363,600 | $160,000 | $203,600 |
| 2014 | $3,678 | $315,000 | $130,000 | $185,000 |
Source: Public Records
Map
Nearby Homes
- 101 Westside Blvd
- 500 Duran Dr
- 601 Chaparral Ct
- 1 Appletree Ln Unit 1
- 713 7th St
- 805 South St Unit 3
- 805 South St Unit 17
- 70 Chestnut Ln Unit 70
- 190 San Benito St
- 0 Hwy 25 Unit 21712114
- 1261 South St
- 400 San Benito St Unit 309
- 400 San Benito St Unit 308
- 400 San Benito St Unit 202
- 400 San Benito St Unit 304
- 400 San Benito St Unit 212
- 400 San Benito St Unit 312
- 220 4th St
- 435 San Benito St
- 345 6th St