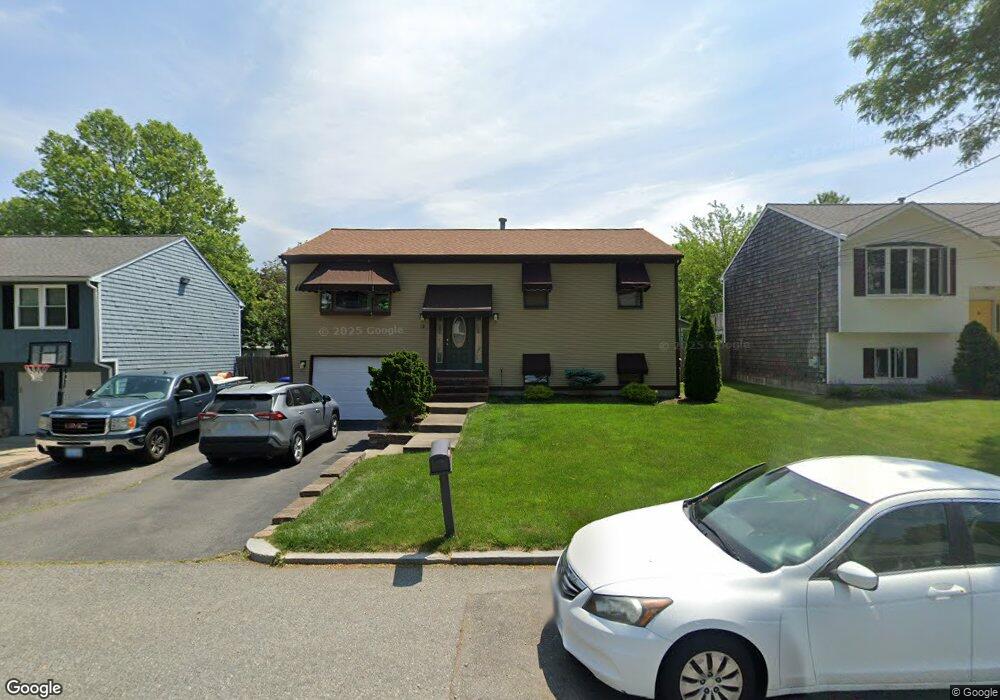
52 Lynde St Providence, RI 02908
Elmhurst NeighborhoodEstimated Value: $408,000 - $512,000
3
Beds
2
Baths
1,176
Sq Ft
$398/Sq Ft
Est. Value
About This Home
This home is located at 52 Lynde St, Providence, RI 02908 and is currently estimated at $467,828, approximately $397 per square foot. 52 Lynde St is a home located in Providence County with nearby schools including St. Augustine School, Mount Pleasant Academy, and La Salle Academy.
Ownership History
Date
Name
Owned For
Owner Type
Purchase Details
Closed on
Dec 23, 2025
Sold by
Turchetta Kenneth M
Bought by
Turcheta Kenneth M
Current Estimated Value
Purchase Details
Closed on
Mar 9, 2018
Sold by
Turchetta Sandra
Bought by
Pellegrino Dora
Purchase Details
Closed on
Mar 26, 1990
Sold by
Annese Constr Inc
Bought by
Turchetta Kenneth M
Create a Home Valuation Report for This Property
The Home Valuation Report is an in-depth analysis detailing your home's value as well as a comparison with similar homes in the area
Home Values in the Area
Average Home Value in this Area
Purchase History
| Date | Buyer | Sale Price | Title Company |
|---|---|---|---|
| Turcheta Kenneth M | -- | -- | |
| Pellegrino Dora | -- | -- | |
| Turchetta Kenneth M | $134,000 | -- |
Source: Public Records
Mortgage History
| Date | Status | Borrower | Loan Amount |
|---|---|---|---|
| Previous Owner | Turchetta Kenneth M | $150,000 | |
| Previous Owner | Turchetta Kenneth M | $65,000 | |
| Previous Owner | Turchetta Kenneth M | $69,000 | |
| Previous Owner | Turchetta Kenneth M | $76,900 |
Source: Public Records
Tax History
| Year | Tax Paid | Tax Assessment Tax Assessment Total Assessment is a certain percentage of the fair market value that is determined by local assessors to be the total taxable value of land and additions on the property. | Land | Improvement |
|---|---|---|---|---|
| 2025 | $3,683 | $438,500 | $164,000 | $274,500 |
| 2024 | $6,100 | $332,400 | $106,600 | $225,800 |
| 2023 | $6,100 | $332,400 | $106,600 | $225,800 |
| 2022 | $5,917 | $332,400 | $106,600 | $225,800 |
| 2021 | $5,980 | $243,500 | $85,900 | $157,600 |
| 2020 | $5,980 | $243,500 | $85,900 | $157,600 |
| 2019 | $5,980 | $243,500 | $85,900 | $157,600 |
| 2018 | $6,031 | $188,700 | $69,100 | $119,600 |
| 2017 | $6,031 | $188,700 | $69,100 | $119,600 |
| 2016 | $5,986 | $187,300 | $69,100 | $118,200 |
| 2015 | $5,491 | $165,900 | $69,100 | $96,800 |
| 2014 | $5,599 | $165,900 | $69,100 | $96,800 |
| 2013 | $5,599 | $165,900 | $69,100 | $96,800 |
Source: Public Records
Map
Nearby Homes
- 46 Longwood Ave
- 112 Longwood Ave
- 116 Longwood Ave
- 1189 Smith St
- 197 Enfield Ave
- 68 Enfield Ave
- 84 Enfield Ave
- 31 Elmcrest Ave
- 797 Academy Ave
- 36 Walton St
- 73 High Service Ave
- 354 Jastram St
- 507 Sharon St
- 41 Wellesley Ave
- 299 Jastram St
- 39 Hillview Ave
- 616 River Ave
- 1548 Smith St
- 15 Lookout Ave
- 31 Joseph St
Your Personal Tour Guide
Ask me questions while you tour the home.