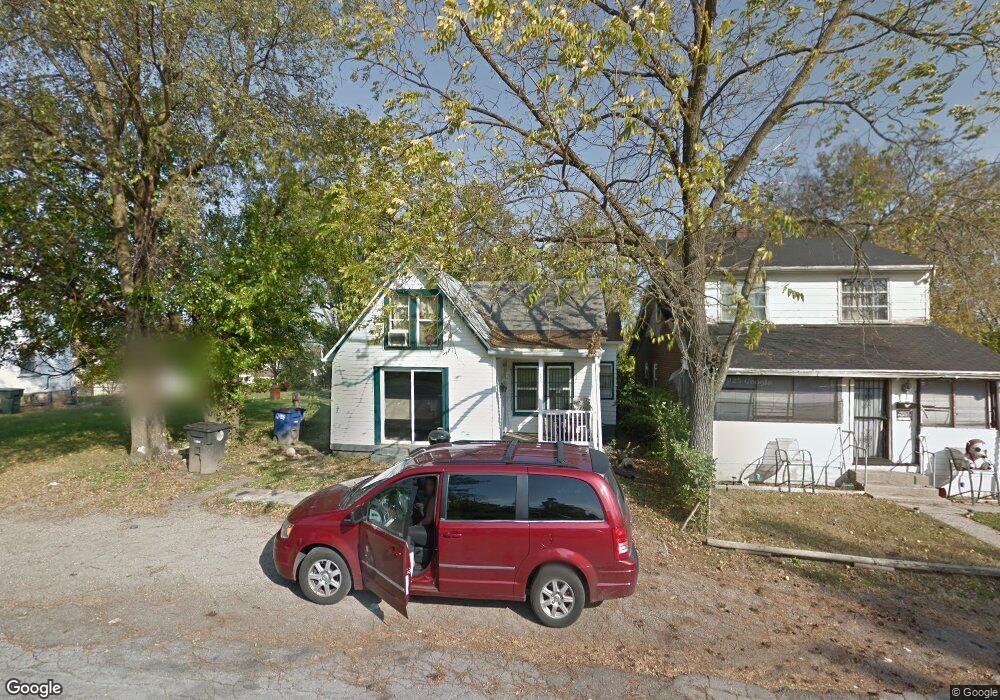
52 Mia Ave Dayton, OH 45417
Residence Park NeighborhoodEstimated Value: $70,000 - $75,000
2
Beds
1
Bath
1,219
Sq Ft
$59/Sq Ft
Est. Value
About This Home
This home is located at 52 Mia Ave, Dayton, OH 45417 and is currently estimated at $71,563, approximately $58 per square foot. 52 Mia Ave is a home located in Montgomery County with nearby schools including International School at Residence Park, Westwood Elementary, and Louise Troy Elementary.
Ownership History
Date
Name
Owned For
Owner Type
Purchase Details
Closed on
Jul 14, 2025
Sold by
Green Charles W
Bought by
Kacucu Innocent
Current Estimated Value
Purchase Details
Closed on
Jun 12, 2024
Sold by
Bailoy Mildred
Bought by
Jeen Charles W
Purchase Details
Closed on
Feb 16, 2022
Sold by
Mildred Bailey
Bought by
Pty Sec
Purchase Details
Closed on
May 2, 2014
Sold by
Williams Lajuana
Bought by
Bailey Mildred
Purchase Details
Closed on
Mar 2, 2014
Sold by
Winston Deonte
Bought by
Williams Lajuana
Purchase Details
Closed on
Aug 10, 2013
Sold by
Scott Nathaniel and Scott Lloyd
Bought by
Winston Deonte G
Purchase Details
Closed on
Mar 26, 2012
Sold by
Scott Darrell and Scott Paula J
Bought by
Winston Deonte G
Purchase Details
Closed on
Jun 1, 2001
Sold by
Estate Of Albert L Scott
Bought by
Scott Paula J and Scott Christina
Create a Home Valuation Report for This Property
The Home Valuation Report is an in-depth analysis detailing your home's value as well as a comparison with similar homes in the area
Home Values in the Area
Average Home Value in this Area
Purchase History
| Date | Buyer | Sale Price | Title Company |
|---|---|---|---|
| Kacucu Innocent | $5,000 | None Listed On Document | |
| Jeen Charles W | $38,900 | None Listed On Document | |
| Pty Sec | $5,721 | None Listed On Document | |
| Bailey Mildred | -- | None Available | |
| Williams Lajuana | $29,000 | None Available | |
| Winston Deonte G | $5,000 | Midwest Title Company | |
| Winston Deonte G | $5,000 | Midwest Title Company | |
| Scott Paula J | -- | -- |
Source: Public Records
Tax History Compared to Growth
Tax History
| Year | Tax Paid | Tax Assessment Tax Assessment Total Assessment is a certain percentage of the fair market value that is determined by local assessors to be the total taxable value of land and additions on the property. | Land | Improvement |
|---|---|---|---|---|
| 2024 | $797 | $13,590 | $2,190 | $11,400 |
| 2023 | $797 | $13,590 | $2,190 | $11,400 |
| 2022 | $870 | $11,490 | $1,860 | $9,630 |
| 2021 | $865 | $11,490 | $1,860 | $9,630 |
| 2020 | $938 | $11,490 | $1,860 | $9,630 |
| 2019 | $1,818 | $8,560 | $2,070 | $6,490 |
| 2018 | $942 | $8,560 | $2,070 | $6,490 |
| 2017 | $829 | $8,560 | $2,070 | $6,490 |
| 2016 | $742 | $8,480 | $2,070 | $6,410 |
| 2015 | $685 | $8,480 | $2,070 | $6,410 |
| 2014 | $685 | $8,480 | $2,070 | $6,410 |
| 2012 | -- | $8,740 | $1,930 | $6,810 |
Source: Public Records
Map
Nearby Homes
- 72 Patton Ave
- 4615 Dayview Ave
- 4643 Laurel Dr
- 361 Roxbury Rd
- 733 Cleverly Rd
- 4309 Sylvan Dr
- 720 Mia Ave
- 71 Elkins Ave
- 6925 W Third St
- 775 Goodlow Ave
- 773 Goodlow Ave
- 0 N Gettysburg Ave
- 432 N Gettysburg Ave
- 4126 Sylvan Dr
- 19 S Alder St Unit 21
- 79 N Alder St
- 71 N Alder St
- 4157 Kammer Ave
- 764 Miller Ave
- 45 S Trenton St