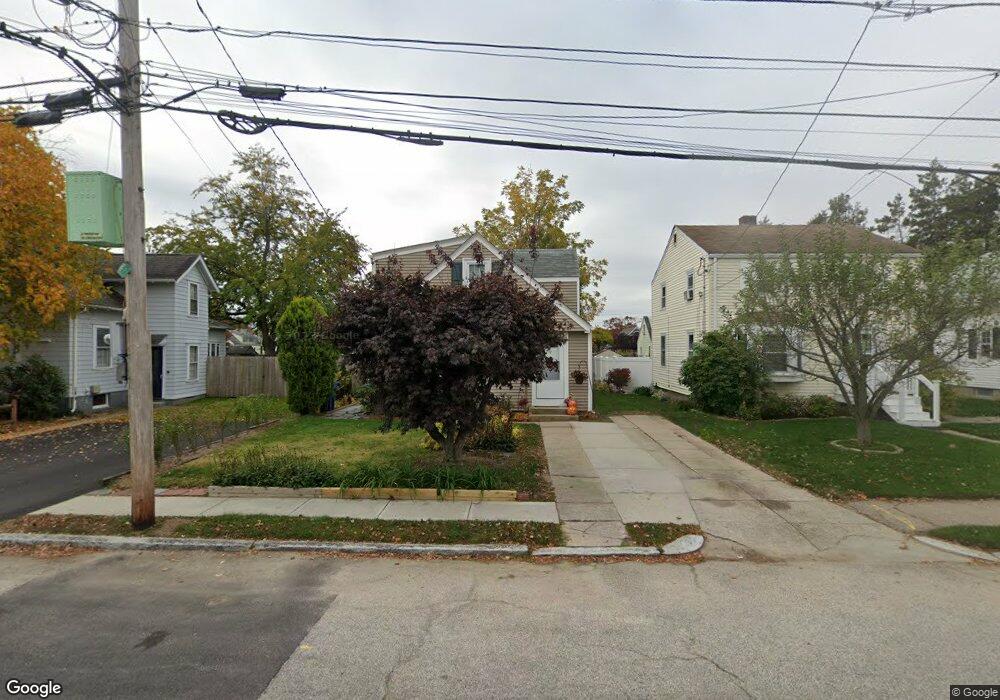
52 Myrtle Ave Cranston, RI 02910
Eden Park NeighborhoodEstimated Value: $395,923 - $451,000
3
Beds
1
Bath
1,410
Sq Ft
$299/Sq Ft
Est. Value
About This Home
This home is located at 52 Myrtle Ave, Cranston, RI 02910 and is currently estimated at $421,981, approximately $299 per square foot. 52 Myrtle Ave is a home located in Providence County with nearby schools including Park View Middle School, Cranston High School East, and Cadence Academy Preschool - Cranston.
Ownership History
Date
Name
Owned For
Owner Type
Purchase Details
Closed on
Mar 12, 1993
Sold by
Walsh Patricia A
Bought by
Leibrich James E and Liebrich Linda
Current Estimated Value
Home Financials for this Owner
Home Financials are based on the most recent Mortgage that was taken out on this home.
Original Mortgage
$94,900
Interest Rate
7.8%
Create a Home Valuation Report for This Property
The Home Valuation Report is an in-depth analysis detailing your home's value as well as a comparison with similar homes in the area
Home Values in the Area
Average Home Value in this Area
Purchase History
| Date | Buyer | Sale Price | Title Company |
|---|---|---|---|
| Leibrich James E | $100,000 | -- |
Source: Public Records
Mortgage History
| Date | Status | Borrower | Loan Amount |
|---|---|---|---|
| Open | Leibrich James E | $75,000 | |
| Closed | Leibrich James E | $90,000 | |
| Closed | Leibrich James E | $94,900 | |
| Previous Owner | Leibrich James E | $62,000 |
Source: Public Records
Tax History
| Year | Tax Paid | Tax Assessment Tax Assessment Total Assessment is a certain percentage of the fair market value that is determined by local assessors to be the total taxable value of land and additions on the property. | Land | Improvement |
|---|---|---|---|---|
| 2025 | $4,439 | $319,800 | $103,800 | $216,000 |
| 2024 | $4,352 | $319,800 | $103,800 | $216,000 |
| 2023 | $4,220 | $223,300 | $68,300 | $155,000 |
| 2022 | $4,133 | $223,300 | $68,300 | $155,000 |
| 2021 | $4,019 | $223,300 | $68,300 | $155,000 |
| 2020 | $3,793 | $182,600 | $65,100 | $117,500 |
| 2019 | $3,793 | $182,600 | $65,100 | $117,500 |
| 2018 | $3,705 | $182,600 | $65,100 | $117,500 |
| 2017 | $3,452 | $150,500 | $58,600 | $91,900 |
| 2016 | $3,379 | $150,500 | $58,600 | $91,900 |
| 2015 | $3,379 | $150,500 | $58,600 | $91,900 |
| 2014 | $3,465 | $151,700 | $58,600 | $93,100 |
Source: Public Records
Map
Nearby Homes
Your Personal Tour Guide
Ask me questions while you tour the home.