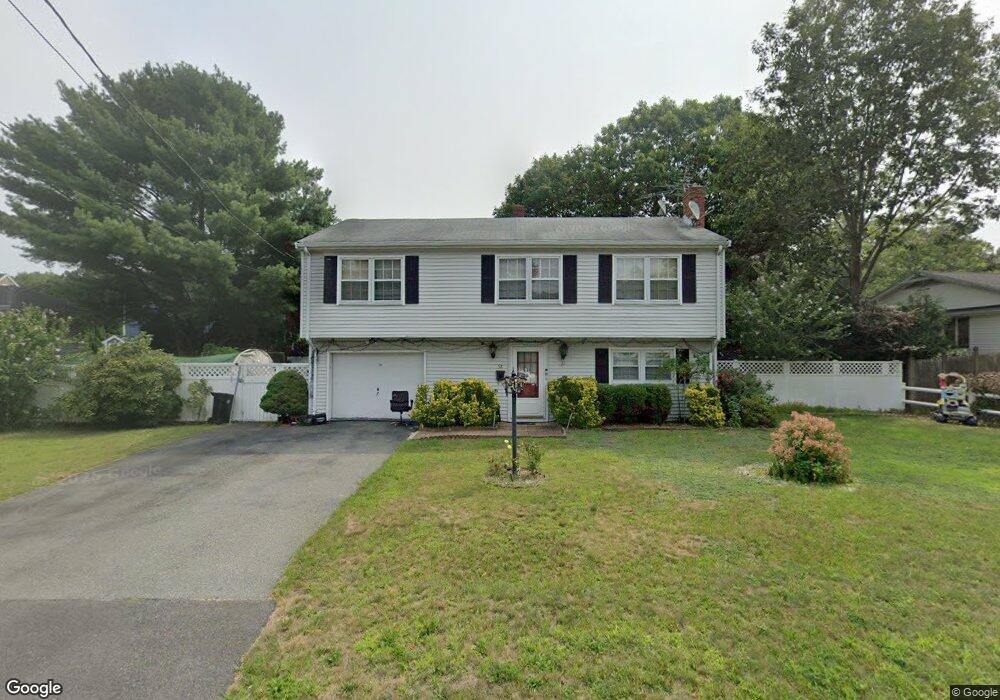
52 N Bassett Rd Brockton, MA 02301
Estimated Value: $527,000 - $613,000
3
Beds
2
Baths
1,712
Sq Ft
$336/Sq Ft
Est. Value
About This Home
This home is located at 52 N Bassett Rd, Brockton, MA 02301 and is currently estimated at $575,985, approximately $336 per square foot. 52 N Bassett Rd is a home located in Plymouth County with nearby schools including Manthala George Jr. School, Louis F Angelo Elementary School, and Hancock Elementary School.
Ownership History
Date
Name
Owned For
Owner Type
Purchase Details
Closed on
Oct 4, 2004
Sold by
Rocha Voldinei and Desilva Edna F
Bought by
Nguyen Huyen
Current Estimated Value
Home Financials for this Owner
Home Financials are based on the most recent Mortgage that was taken out on this home.
Original Mortgage
$324,000
Outstanding Balance
$160,891
Interest Rate
5.81%
Mortgage Type
Purchase Money Mortgage
Estimated Equity
$415,094
Purchase Details
Closed on
Sep 18, 2001
Sold by
Frangakis Konstantinos
Bought by
Rocha Voldinei and Dasilva Edna F
Home Financials for this Owner
Home Financials are based on the most recent Mortgage that was taken out on this home.
Original Mortgage
$190,000
Interest Rate
6.99%
Mortgage Type
Purchase Money Mortgage
Purchase Details
Closed on
Mar 31, 1995
Sold by
Woodland Jacqueline H
Bought by
Frangakis Konstantinos
Create a Home Valuation Report for This Property
The Home Valuation Report is an in-depth analysis detailing your home's value as well as a comparison with similar homes in the area
Home Values in the Area
Average Home Value in this Area
Purchase History
| Date | Buyer | Sale Price | Title Company |
|---|---|---|---|
| Nguyen Huyen | $360,000 | -- | |
| Rocha Voldinei | $200,000 | -- | |
| Frangakis Konstantinos | $124,900 | -- |
Source: Public Records
Mortgage History
| Date | Status | Borrower | Loan Amount |
|---|---|---|---|
| Open | Frangakis Konstantinos | $324,000 | |
| Previous Owner | Frangakis Konstantinos | $226,900 | |
| Previous Owner | Frangakis Konstantinos | $190,000 |
Source: Public Records
Tax History Compared to Growth
Tax History
| Year | Tax Paid | Tax Assessment Tax Assessment Total Assessment is a certain percentage of the fair market value that is determined by local assessors to be the total taxable value of land and additions on the property. | Land | Improvement |
|---|---|---|---|---|
| 2025 | $6,261 | $517,000 | $144,600 | $372,400 |
| 2024 | $5,860 | $487,500 | $144,600 | $342,900 |
| 2023 | $5,480 | $422,200 | $109,500 | $312,700 |
| 2022 | $5,288 | $378,500 | $99,500 | $279,000 |
| 2021 | $4,931 | $340,100 | $93,500 | $246,600 |
| 2020 | $5,025 | $331,700 | $89,600 | $242,100 |
| 2019 | $5,130 | $330,100 | $83,700 | $246,400 |
| 2018 | $4,521 | $281,500 | $83,700 | $197,800 |
| 2017 | $4,307 | $267,500 | $83,700 | $183,800 |
| 2016 | $4,376 | $252,100 | $79,800 | $172,300 |
| 2015 | $3,904 | $215,100 | $79,800 | $135,300 |
| 2014 | $3,742 | $206,400 | $79,800 | $126,600 |
Source: Public Records
Map
Nearby Homes