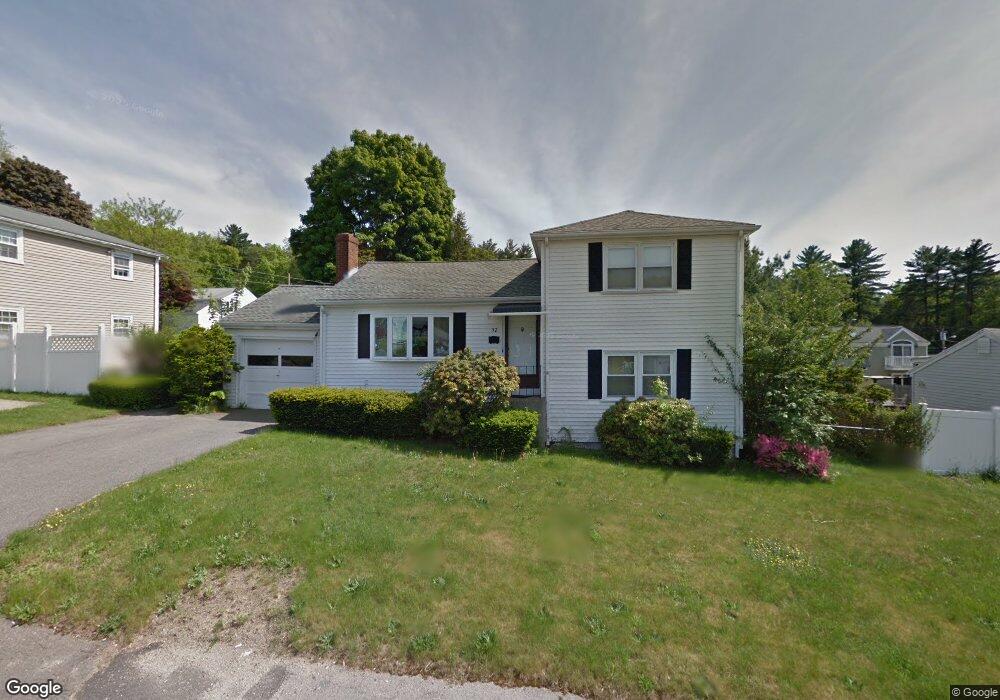
52 Rose Way Holbrook, MA 02343
Estimated Value: $540,000 - $623,000
4
Beds
2
Baths
1,336
Sq Ft
$421/Sq Ft
Est. Value
About This Home
This home is located at 52 Rose Way, Holbrook, MA 02343 and is currently estimated at $562,678, approximately $421 per square foot. 52 Rose Way is a home located in Norfolk County with nearby schools including John F. Kennedy Elementary School, Holbrook Middle High School, and Boston Higashi School.
Ownership History
Date
Name
Owned For
Owner Type
Purchase Details
Closed on
Dec 12, 2013
Sold by
Morrison Katherine D
Bought by
Morrison Neal J
Current Estimated Value
Purchase Details
Closed on
Dec 30, 2009
Sold by
Greene Christine E and Rull Joseph E
Bought by
Morrison Neal J and Morrison Katherine D
Home Financials for this Owner
Home Financials are based on the most recent Mortgage that was taken out on this home.
Original Mortgage
$257,254
Interest Rate
4.85%
Mortgage Type
Purchase Money Mortgage
Purchase Details
Closed on
Jan 16, 2009
Sold by
Greene Christine E
Bought by
Greene Christine E and Rull Joseph E
Create a Home Valuation Report for This Property
The Home Valuation Report is an in-depth analysis detailing your home's value as well as a comparison with similar homes in the area
Home Values in the Area
Average Home Value in this Area
Purchase History
| Date | Buyer | Sale Price | Title Company |
|---|---|---|---|
| Morrison Neal J | -- | -- | |
| Morrison Neal J | -- | -- | |
| Morrison Neal J | -- | -- | |
| Morrison Neal J | $262,000 | -- | |
| Morrison Neal J | $262,000 | -- | |
| Greene Christine E | -- | -- | |
| Greene Christine E | -- | -- |
Source: Public Records
Mortgage History
| Date | Status | Borrower | Loan Amount |
|---|---|---|---|
| Previous Owner | Morrison Neal J | $257,254 |
Source: Public Records
Tax History
| Year | Tax Paid | Tax Assessment Tax Assessment Total Assessment is a certain percentage of the fair market value that is determined by local assessors to be the total taxable value of land and additions on the property. | Land | Improvement |
|---|---|---|---|---|
| 2025 | $57 | $430,700 | $219,000 | $211,700 |
| 2024 | $5,575 | $414,800 | $207,800 | $207,000 |
| 2023 | $5,904 | $383,900 | $188,800 | $195,100 |
| 2022 | $5,628 | $341,300 | $171,700 | $169,600 |
| 2021 | $5,576 | $323,800 | $160,400 | $163,400 |
| 2020 | $5,728 | $311,800 | $152,400 | $159,400 |
| 2019 | $5,562 | $285,800 | $136,200 | $149,600 |
| 2018 | $5,806 | $280,900 | $136,200 | $144,700 |
| 2017 | $5,430 | $259,800 | $120,000 | $139,800 |
| 2016 | $5,030 | $256,100 | $120,000 | $136,100 |
| 2015 | $4,795 | $251,300 | $119,000 | $132,300 |
| 2014 | $4,647 | $247,600 | $119,000 | $128,600 |
Source: Public Records
Map
Nearby Homes
- 8 Dianthus Rd
- 38 Roosevelt St
- 278 N Franklin St
- 1696 Liberty St
- 5 Clarendon Cir Unit Lot 4
- 123-125 N Franklin St
- 27 Winter St
- 20 Isabelle Ave
- 120 Roberts Ave
- 155 Union St
- 129 Albee Dr
- 24 Evelyn Ln
- 1 Young Terrace
- 249 Mill St
- 229 Mill St
- 217 Mill St
- 152 S Franklin St
- 12 Tucker Terrace
- 181 S Franklin St Unit 102
- 181 S Franklin St Unit 206
Your Personal Tour Guide
Ask me questions while you tour the home.