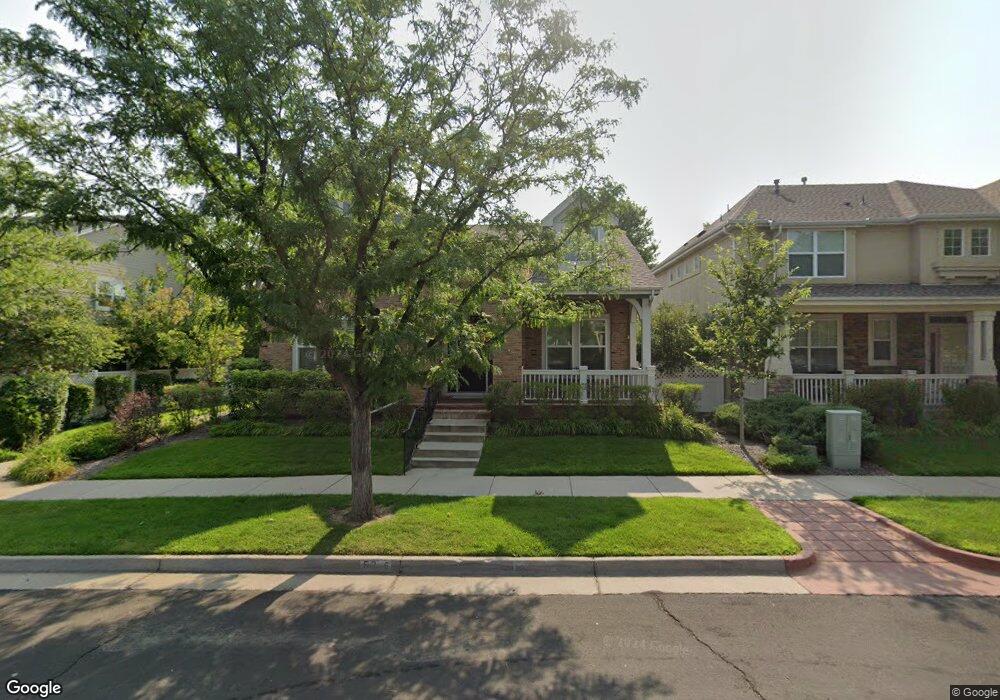
52 S Roslyn St Denver, CO 80230
Lowry NeighborhoodEstimated Value: $994,016 - $1,095,000
3
Beds
3
Baths
3,515
Sq Ft
$292/Sq Ft
Est. Value
About This Home
This home is located at 52 S Roslyn St, Denver, CO 80230 and is currently estimated at $1,025,504, approximately $291 per square foot. 52 S Roslyn St is a home located in Denver County with nearby schools including Lowry Elementary School, Hill Campus of Arts & Sciences, and George Washington High School.
Ownership History
Date
Name
Owned For
Owner Type
Purchase Details
Closed on
Sep 18, 2015
Sold by
Rachel L Kinard Revocable Trust
Bought by
Wolf Andrea Lynn and Wolf Harold Frederick
Current Estimated Value
Home Financials for this Owner
Home Financials are based on the most recent Mortgage that was taken out on this home.
Original Mortgage
$496,000
Outstanding Balance
$390,636
Interest Rate
3.99%
Mortgage Type
New Conventional
Estimated Equity
$634,868
Purchase Details
Closed on
Sep 22, 2011
Sold by
The John C Kinard Revocable Trust
Bought by
The Rachael L Kinard Revocable Trust
Purchase Details
Closed on
Nov 10, 2004
Sold by
Pulte Bryan
Bought by
John C Kinard Revocable Trust
Purchase Details
Closed on
Jul 19, 2001
Sold by
Village Homes Of Colorado Inc
Bought by
Pulte Bryan
Create a Home Valuation Report for This Property
The Home Valuation Report is an in-depth analysis detailing your home's value as well as a comparison with similar homes in the area
Home Values in the Area
Average Home Value in this Area
Purchase History
| Date | Buyer | Sale Price | Title Company |
|---|---|---|---|
| Wolf Andrea Lynn | $620,000 | Assured Title Agency | |
| The Rachael L Kinard Revocable Trust | -- | None Available | |
| John C Kinard Revocable Trust | $531,000 | Fahtco | |
| Pulte Bryan | $427,500 | Land Title Guarantee Company |
Source: Public Records
Mortgage History
| Date | Status | Borrower | Loan Amount |
|---|---|---|---|
| Open | Wolf Andrea Lynn | $496,000 |
Source: Public Records
Tax History Compared to Growth
Tax History
| Year | Tax Paid | Tax Assessment Tax Assessment Total Assessment is a certain percentage of the fair market value that is determined by local assessors to be the total taxable value of land and additions on the property. | Land | Improvement |
|---|---|---|---|---|
| 2024 | $4,632 | $58,480 | $10,750 | $47,730 |
| 2023 | $4,531 | $58,480 | $10,750 | $47,730 |
| 2022 | $4,135 | $51,990 | $11,650 | $40,340 |
| 2021 | $3,991 | $53,490 | $11,980 | $41,510 |
| 2020 | $3,632 | $48,950 | $11,980 | $36,970 |
| 2019 | $3,530 | $48,950 | $11,980 | $36,970 |
| 2018 | $3,591 | $46,420 | $10,340 | $36,080 |
| 2017 | $3,581 | $46,420 | $10,340 | $36,080 |
| 2016 | $3,773 | $46,270 | $11,431 | $34,839 |
| 2015 | $3,615 | $46,270 | $11,431 | $34,839 |
| 2014 | $3,319 | $39,960 | $7,347 | $32,613 |
Source: Public Records
Map
Nearby Homes
- 41 Quince St
- 7883 E Bayaud Ave
- 7702 E Maple Place Unit 7702
- 8053 E Maple Ave
- 209 Quebec St Unit L
- 159 Quebec St Unit D
- 160 Poplar St Unit A
- 8225 E Fairmount Dr Unit 204
- 6959 E Lowry Blvd
- 43 S Oneida Ct
- 10 Oneida Ct
- 222 S Olive St
- 18 Oneida Ct
- 6975 E Irvington Place
- 185 Olive St
- 8185 E Lowry Blvd Unit 302
- 6820 E Lowry Blvd
- 85 Uinta Way Unit 603
- 85 Uinta Way Unit 702
- 6758 E Lowry Blvd
- 62 S Roslyn St
- 42 S Roslyn St
- 72 S Roslyn St
- 32 S Roslyn St
- 57 S Rosemary St
- 67 S Rosemary St
- 47 S Rosemary St
- 82 S Roslyn St
- 7462 E Archer Place
- 77 S Rosemary St
- 37 S Rosemary St
- 7461 E Archer Place
- 22 S Roslyn St
- 87 S Rosemary St
- 7442 E Archer Place
- 7463 E Bayaud Ave
- 27 S Rosemary St
- 12 S Roslyn St
- 7441 E Archer Place
- 7422 E Archer Place